
- Nonprofits
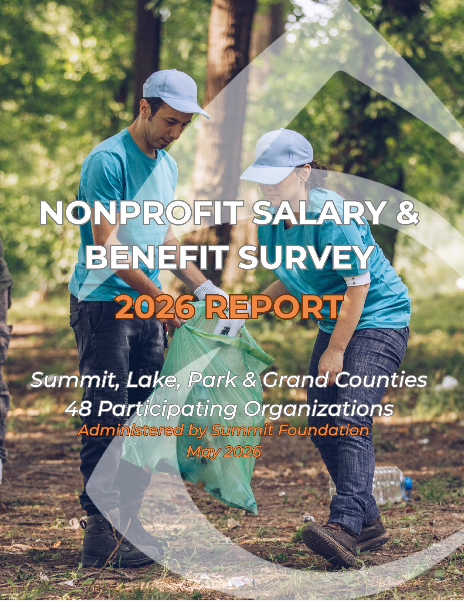
- 2026 Summit County Nonprofit Salary and Benefits Survey
Helping Summit County nonprofits attract, retain, and support talented employees through local compensation benchmarking.
Make Informed Compensation Decisions
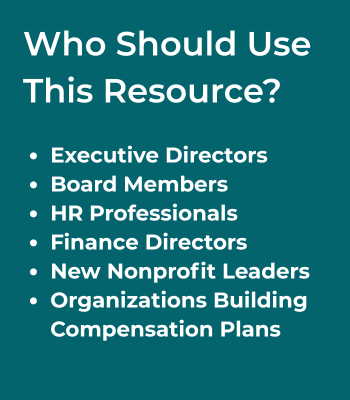
The Summit County Salary & Benefits Survey provides local data to help nonprofit leaders, boards, and HR professionals evaluate salaries, benefits, and staffing decisions with confidence.
 |  |
 | Key FindingsLocal Data MattersSummit County nonprofits face unique workforce challenges, including cost of living, housing, and seasonal labor pressures. Benefits Are Part of RetentionSalary is only one part of a competitive compensation package. PTO, health insurance, retirement, and flexible work options all play a role. Boards Need Better ToolsThis survey helps board members understand local compensation trends and make more informed decisions. Why The Summit Foundation Provides This SurveyStrong nonprofits build a strong community. By providing local compensation data, The Summit Foundation helps organizations attract and retain talented staff while strengthening the nonprofit sector across Summit County. |
| Read Online or Download |
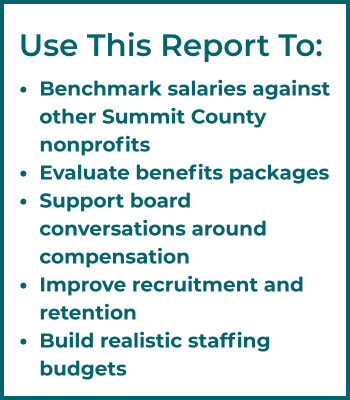
Compare your organization's salaries and benefits to 50+ Summit County nonprofits.
Use local data to support compensation decisions, budget planning, staff retention, and board discussions.
The Summit Foundation extends its gratitude to the 48 nonprofit organizations that participated in this survey, generously sharing the data that makes this benchmark possible. Together, we are building a stronger, more sustainable nonprofit sector for our mountain communities.
This report is designed as a practical benchmarking tool for nonprofit leaders in Summit County and the surrounding area. All data is presented in aggregated and anonymized form. No individual organization or employee is identifiable in any table, figure, or narrative.
The 2026 survey paints a picture of a sector that is maturing but still under pressure. Compared to 2022, nonprofits across Summit, Lake, Park, and Grand Counties are investing more strategically in their workforce by offering more competitive compensation, broader benefits, and greater flexibility, resulting in less turnover. Yet fundamental challenges persist: the cost of living in our mountain communities continues to outpace wage growth, housing remains a barrier to recruitment, and smaller organizations continue to operate with extremely lean staffing.
The Summit Foundation's 2026 Nonprofit Salary & Benefits Survey is the most comprehensive look at compensation and benefits practices across our region to date. Building on the inaugural 2022 survey of 39 Summit County organizations, this edition expands to 48 nonprofits across all of Summit County and areas of Lake, Park, and Grand Counties, specifically the towns of Leadville, Alma, Fairplay, and Kremmling, which share workforce ties to Summit County.
Methodology
The survey was administered online via Microsoft Forms from January 12 through February 27, 2026. Any nonprofit with paid employees within Summit County and adjacent communities of Leadville, Alma, Fairplay and Kremmling were eligible to participate. Leaders in the organization with a comprehensive understanding of employee salaries and benefits were asked to fill out the survey anonymously. Of approximately 90 eligible nonprofit organizations contacted across the region, 48 submitted complete responses, yielding a 53% participation rate. This is a strong response rate from which to draw meaningful conclusions.
Survey Scope
Survey questions gathered information on the following:
• General organizational characteristics (staff size, budget range, purpose area, county).
• Salary ranges and pay levels for common position categories.
• Benefits offered including health insurance, retirement, paid leave, etc.
• Compensation practices including bonuses, stipends, and cost-of-living adjustments.
• Staff retention, turnover trends, and workforce challenges.
• Parental and family leave practices (new in 2026).
• Qualitative feedback on challenges and innovative practices.
Compensation is rising, but not fast enough.
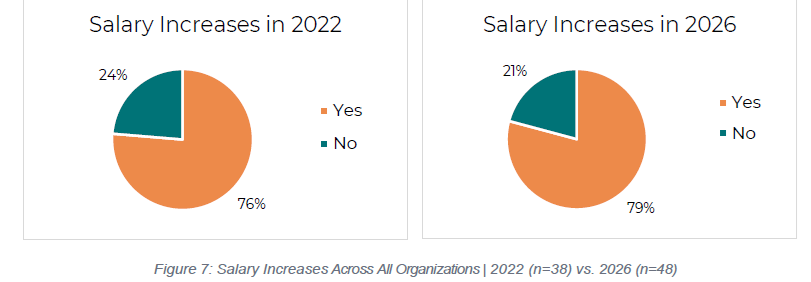
79% of organizations gave raises, with 3–5% being the most common increase. However, with inflation and the region's extreme cost of living, many organizations describe an ongoing gap between wages and the true cost of living.
Benefits are broadening.
Availability of retirement benefits jumped from 59% to 75%. ICHRA plans have become the dominant health insurance model. Dental and vision coverage each hover near 48%.
Flexibility is now standard.
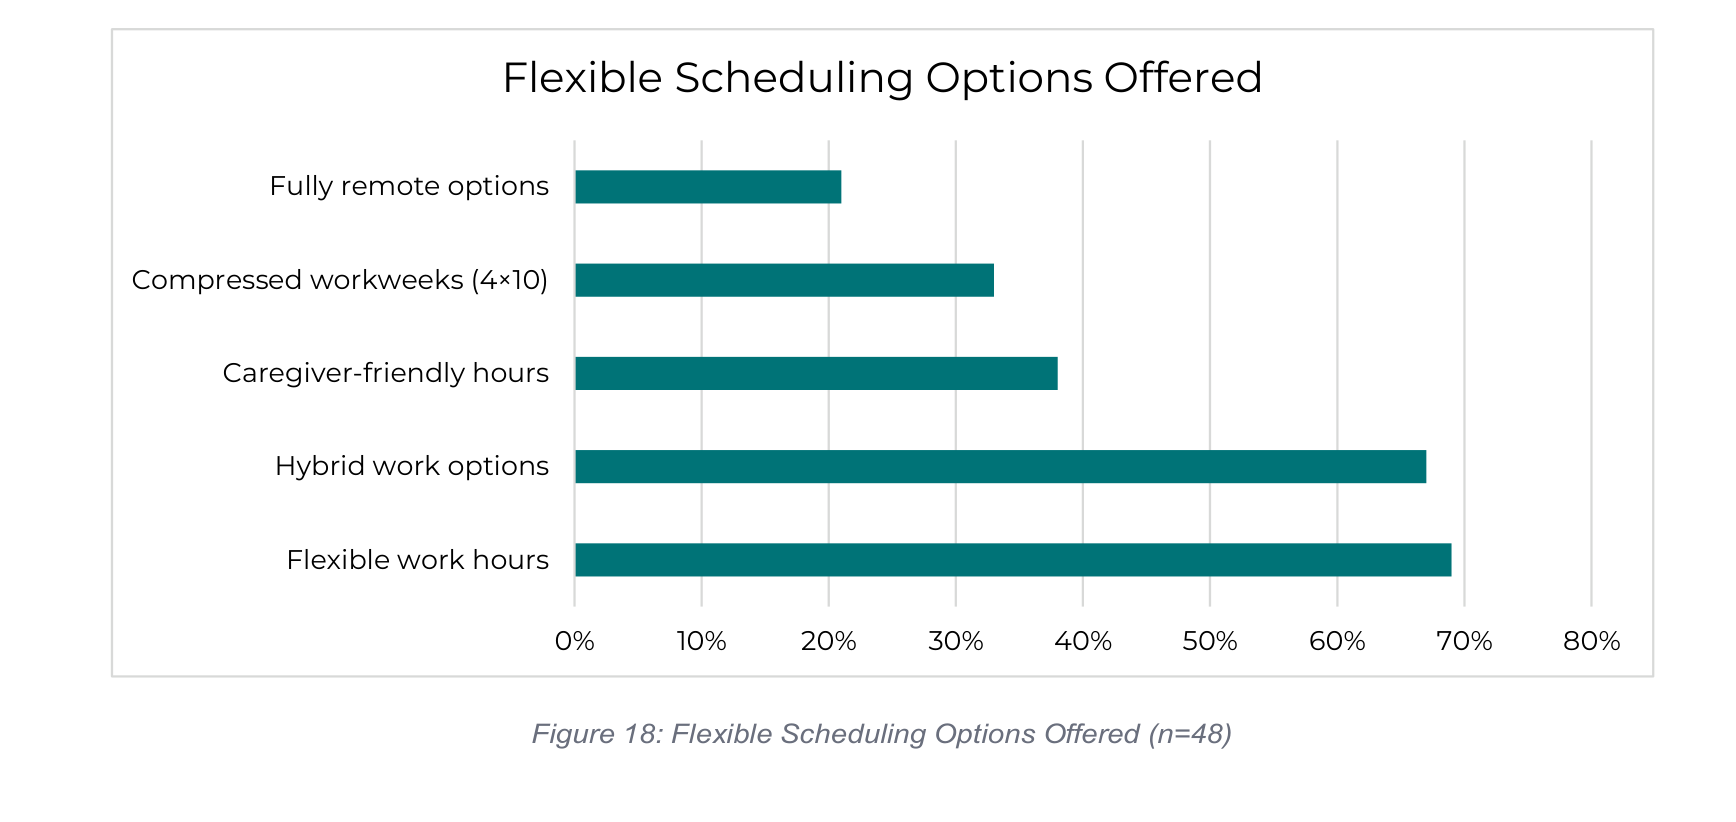
96% of organizations offer some form of flexible scheduling, including hybrid work (67%), flexible hours (69%), and compressed workweeks (33%).
Workforce stability is improving but fragile.
Turnover has declined from 35% to 31%, but cost of living, salary limitations, and housing constraints continue to drive departures.
Small nonprofits face compounding challenges.
Organizations with budgets under $500K are significantly less likely to offer health insurance, retirement, or competitive salaries.
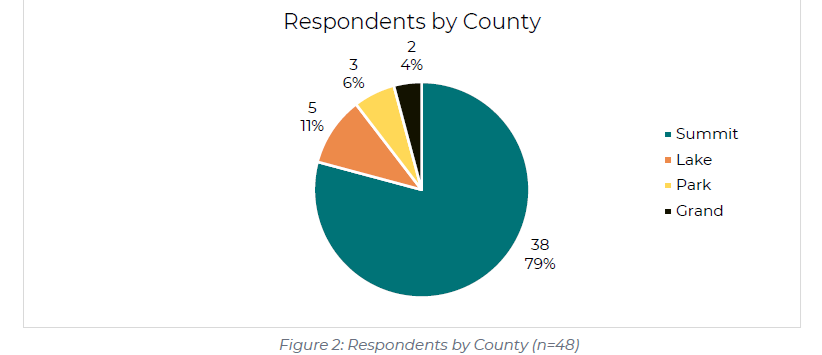
The 48 responding organizations represent a cross-section of the four-county nonprofit community and are representative of the nonprofits serving Summit County and surrounding bedroom communities.
Geographic Distribution
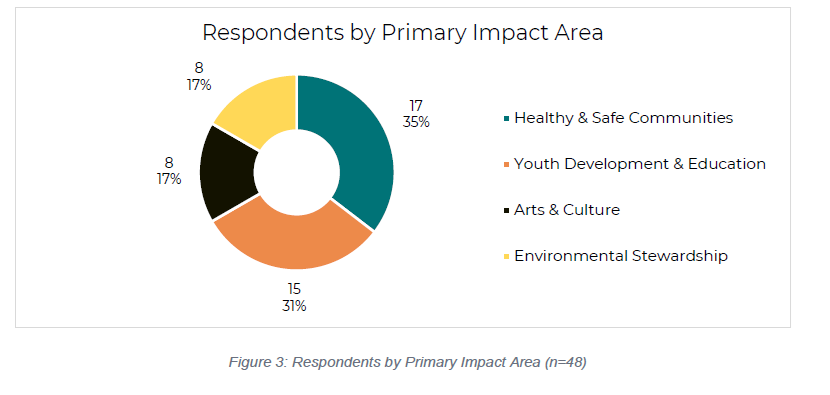
Primary Impact Area
Annual Budget Size
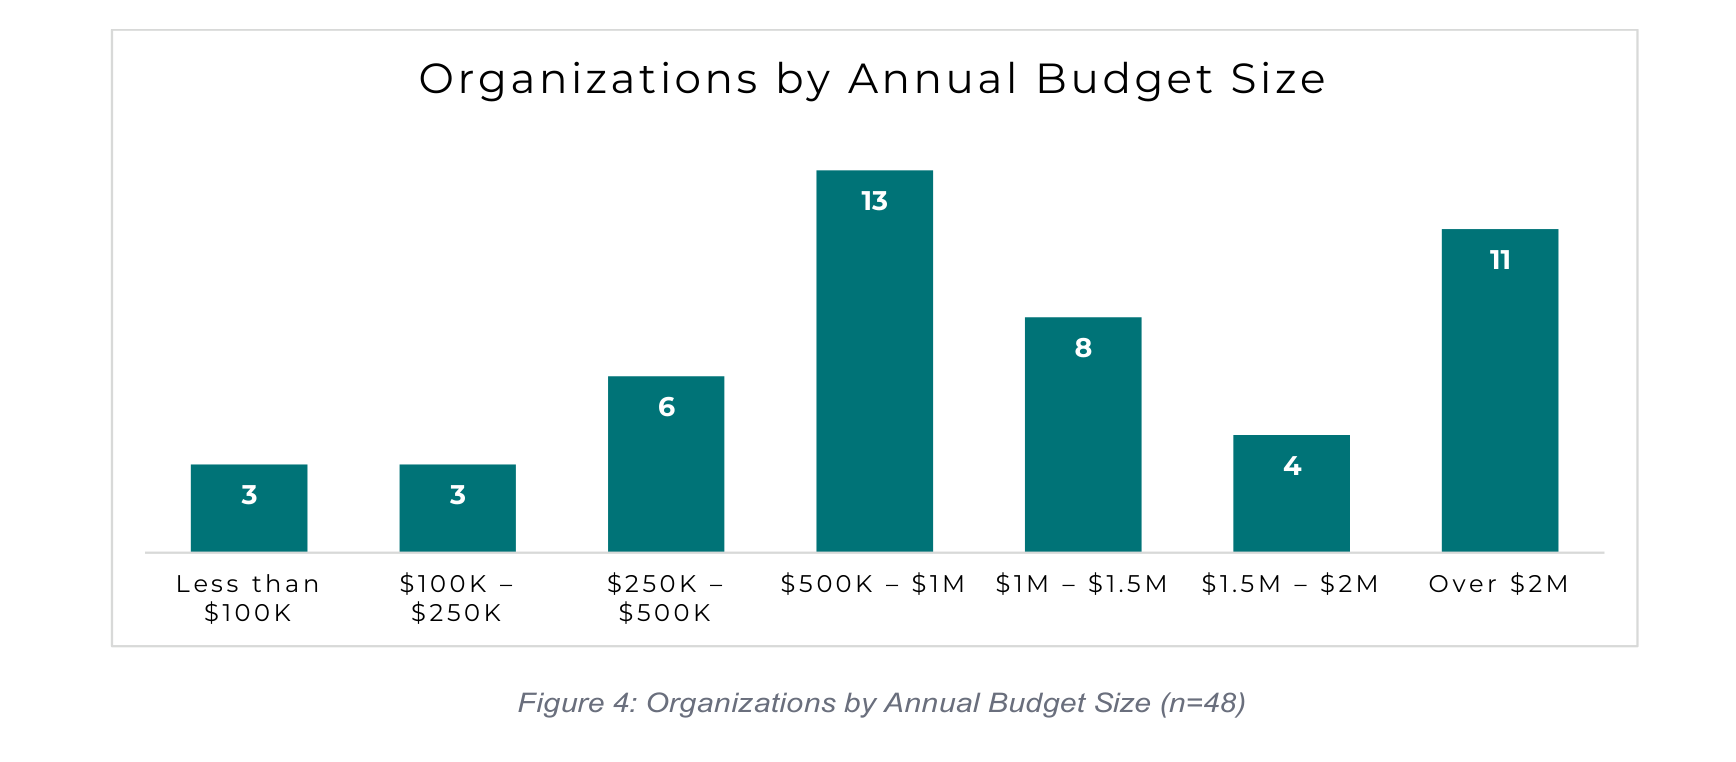
The 2022 survey found 55% of organizations had budgets under $500K. By 2026, that share dropped to 25%, likely reflecting sector growth, though shifts in which organizations responded may also be a factor.
Across 48 organizations, the nonprofit sector employs or engages an estimated 1,600+ individuals, or an average of 34 workers per organization:
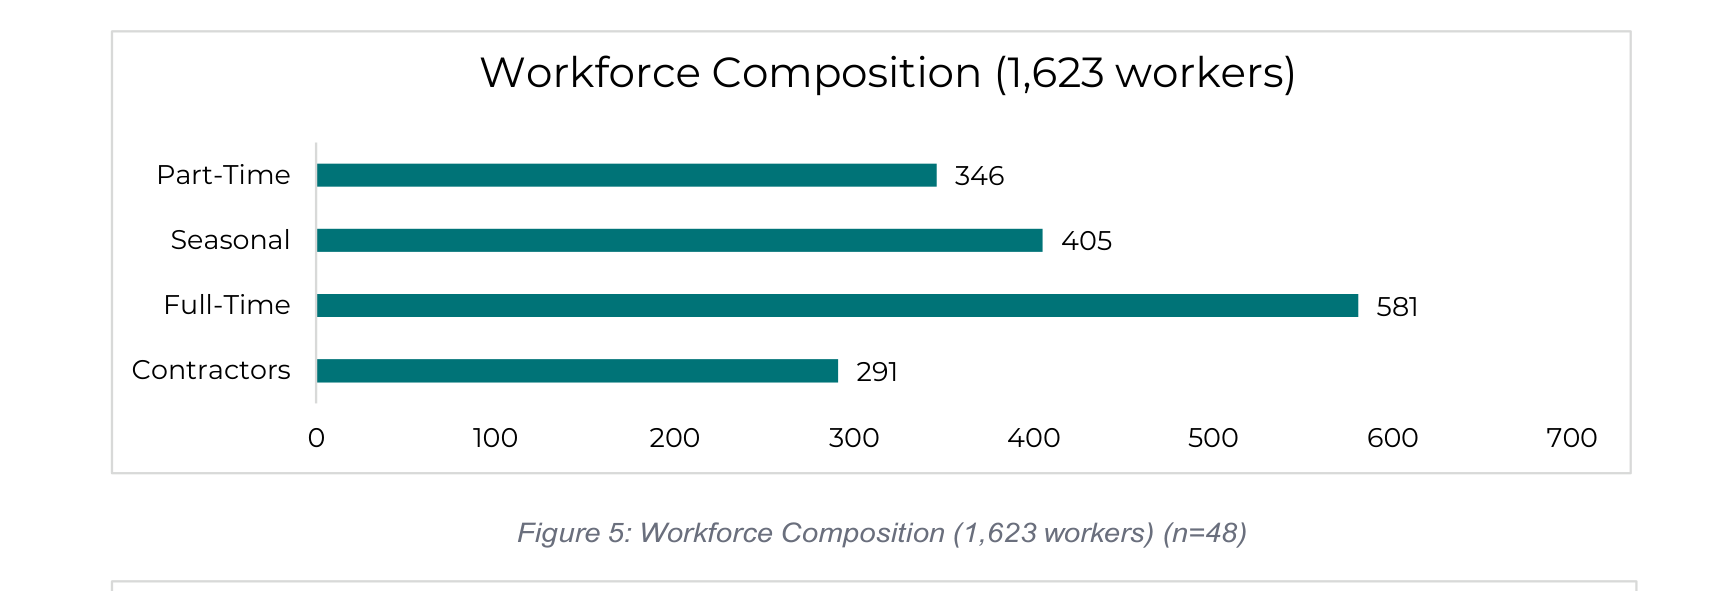
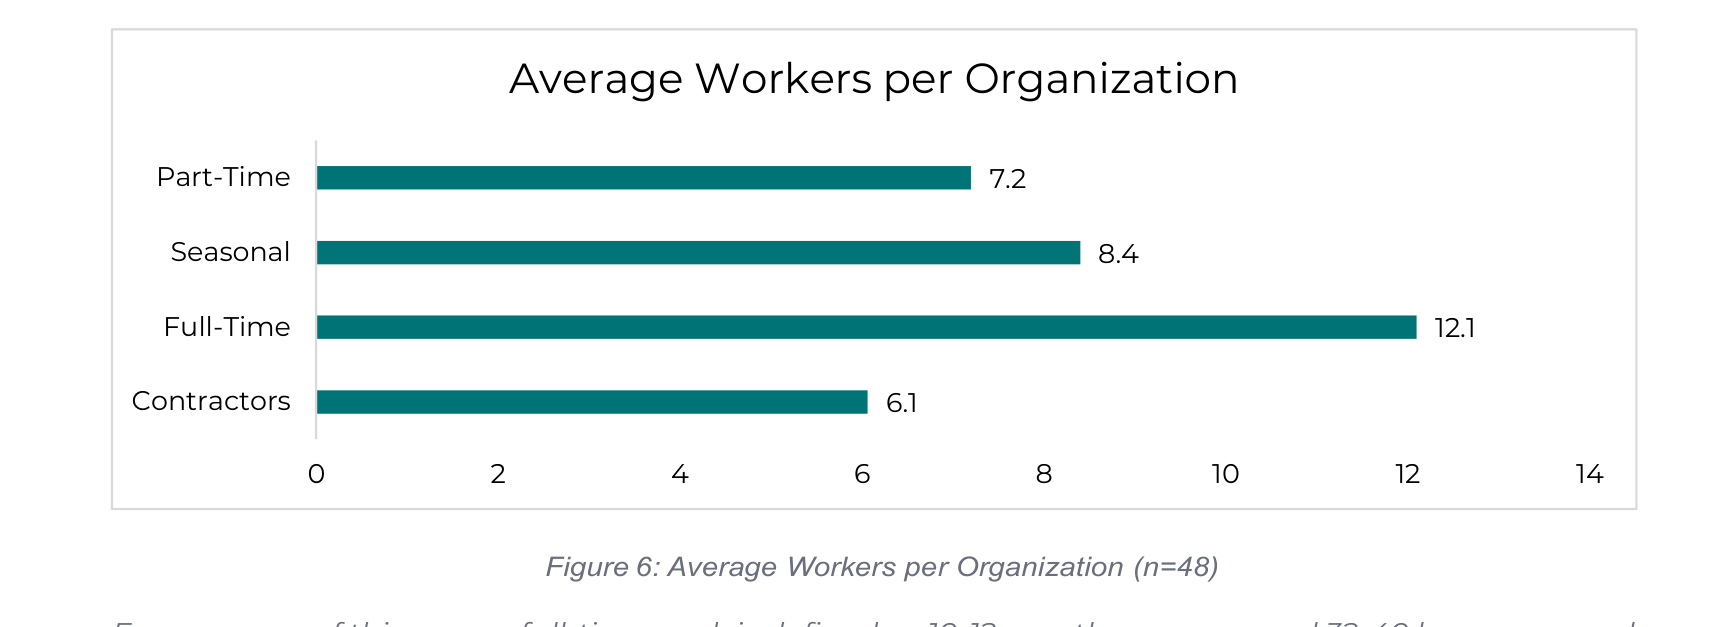
For purposes of this survey, full-time work is defined as 10-12 months per year and 32-40 hours per week, part-time work is defined as less than 32 hours per week, seasonal work is defined as 3-5 months per year, up to twice a year, and a contractor is defined as an individual to whom a 1099 is issued.
Contracted workers represent 18% of the surveyed workforce, consistent with U.S. averages estimated at 10–15%. The slightly higher range reflects two realities common in mountain communities: the seasonal nature of many programs and the financial constraints that make W-2 employment difficult for smaller organizations.
Salary Increases
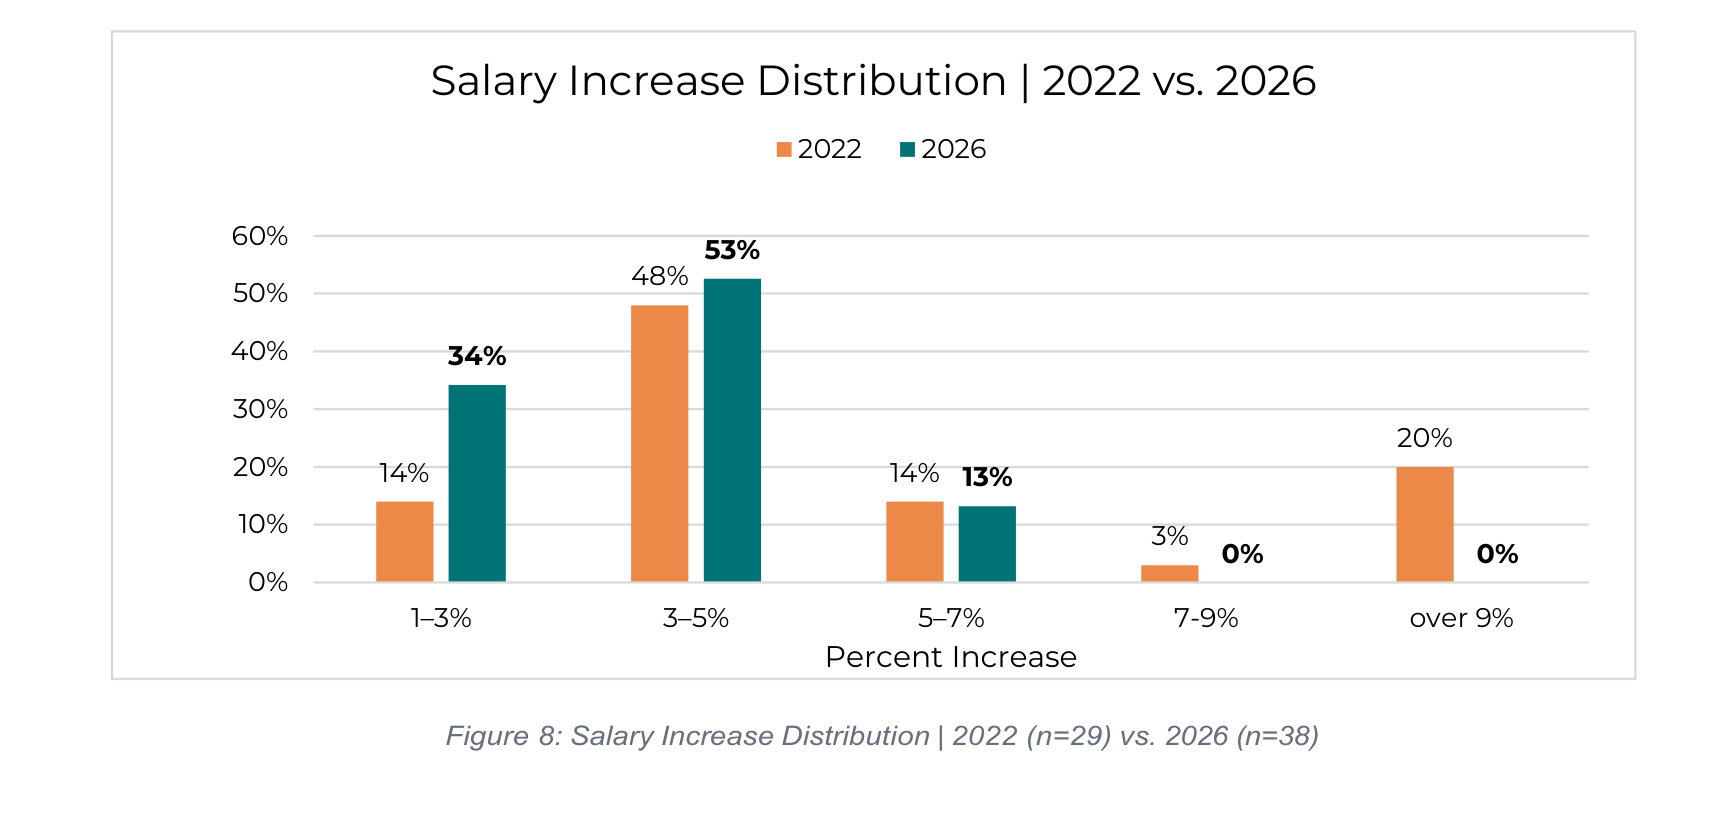
Salary increases participation remains strong at 79% (38/48), in line with 76% in 2022. However, the distribution has shifted: 1–3% increases now represent 34% of respondents (up from 14% in 2022), and increases above 7%, once reported by 23% of organizations, are no longer occurring. The latter were recognized as one-time, often across-the-board adjustments to remedy historically low compensation, and appear to have run their course.
Basis for Salary Increases
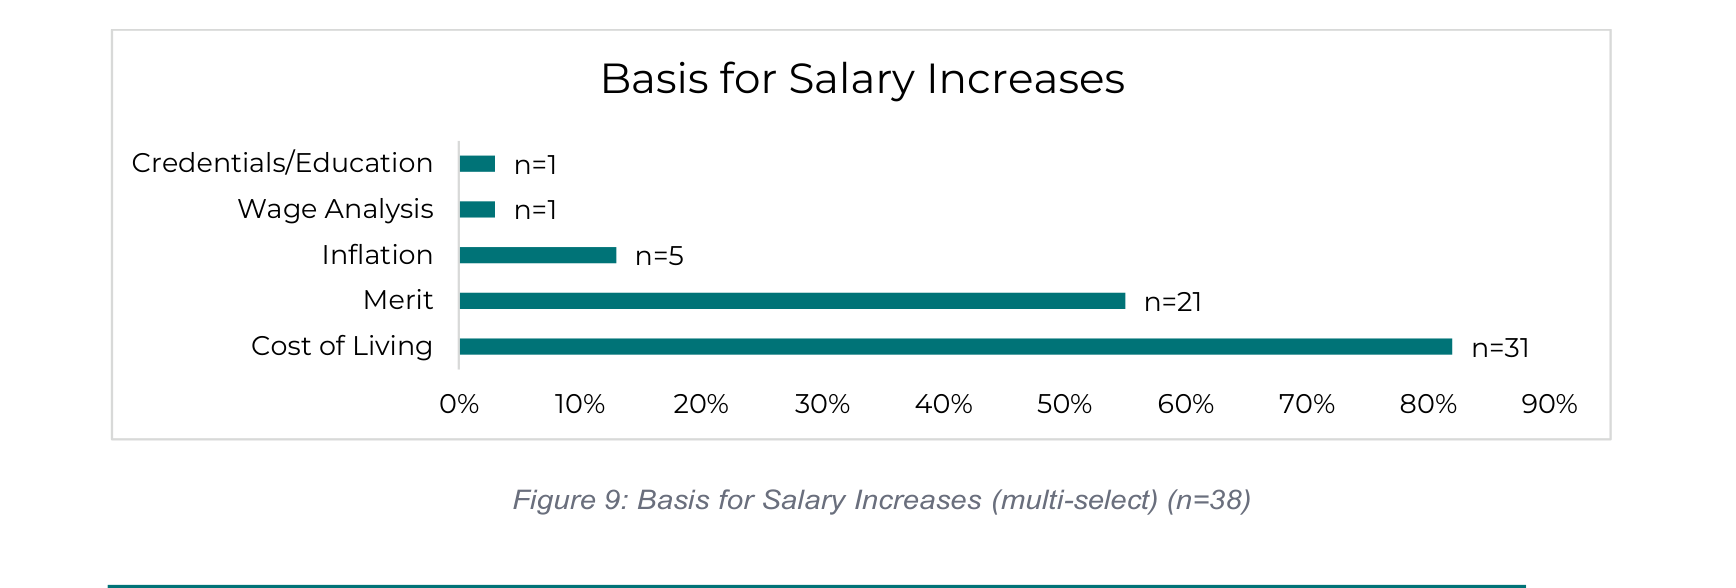
Cost of living adjustments have become the dominant driver of salary increases. In 2022, merit and cost of living were roughly equally cited.
Cost of Living Adjustments (COLA)
65% of organizations provide formal COLA adjustments, with 3% being the most reported rate.
Executive Director Compensation
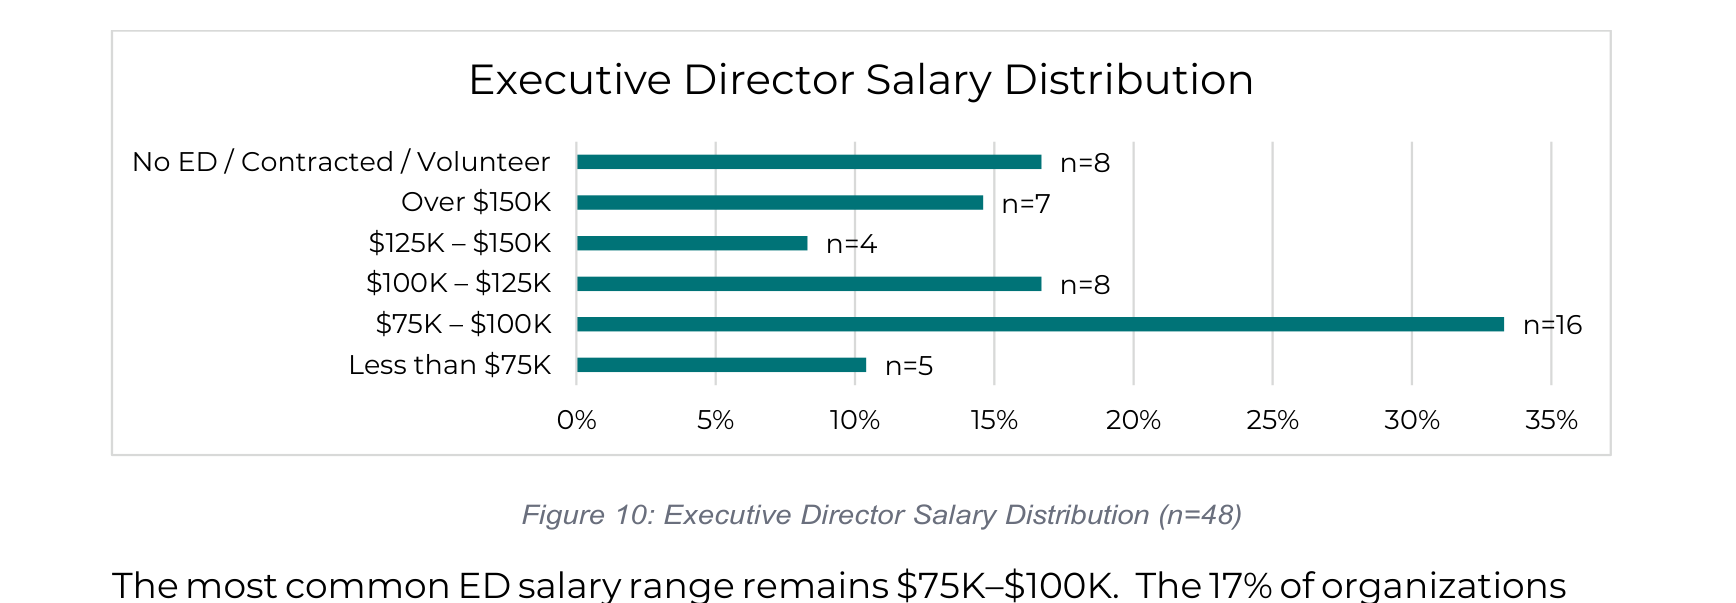
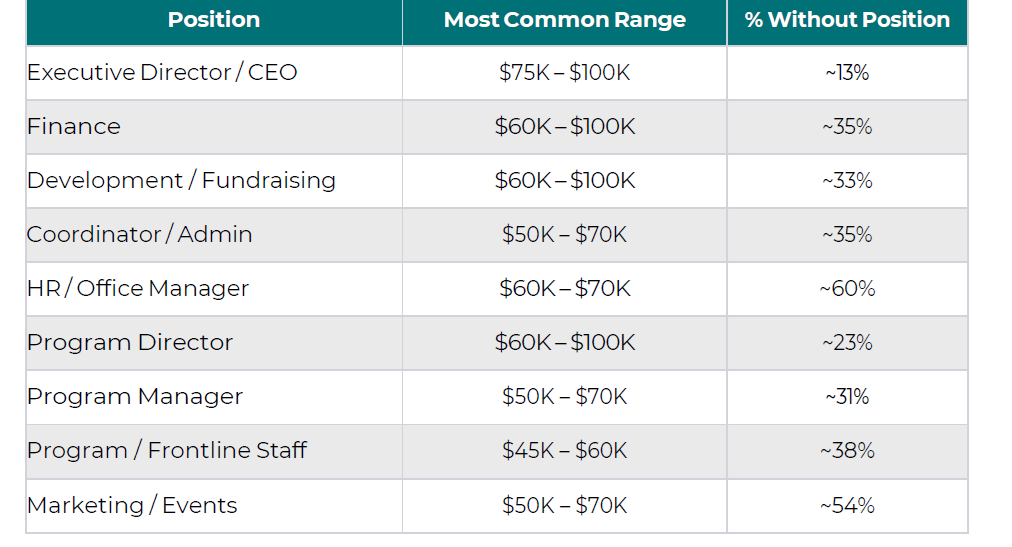
The most common ED salary range remains $75K–$100K. The 17% of organizations without a traditional ED, relying on contracted leadership, volunteer directors, or co-directors, illustrates the lean staffing model among nonprofits.
Salaries by Position
The following table summarizes the most common salary ranges and the percentage of organizations without that position:
Bonuses & Stipends
58% of organizations provide bonuses (a one-time reward in addition to salary). A large majority offer them to all employees, with a few organizations providing them to top-level or full-time salaried employees only. Bonuses are most commonly in the $501–$1,500 range and based on a combination of merit and organizational performance. 38% of organizations provide stipends, most frequently for cell phone/technology, professional development, and gear/uniforms.
Most Commonly Offered Benefits
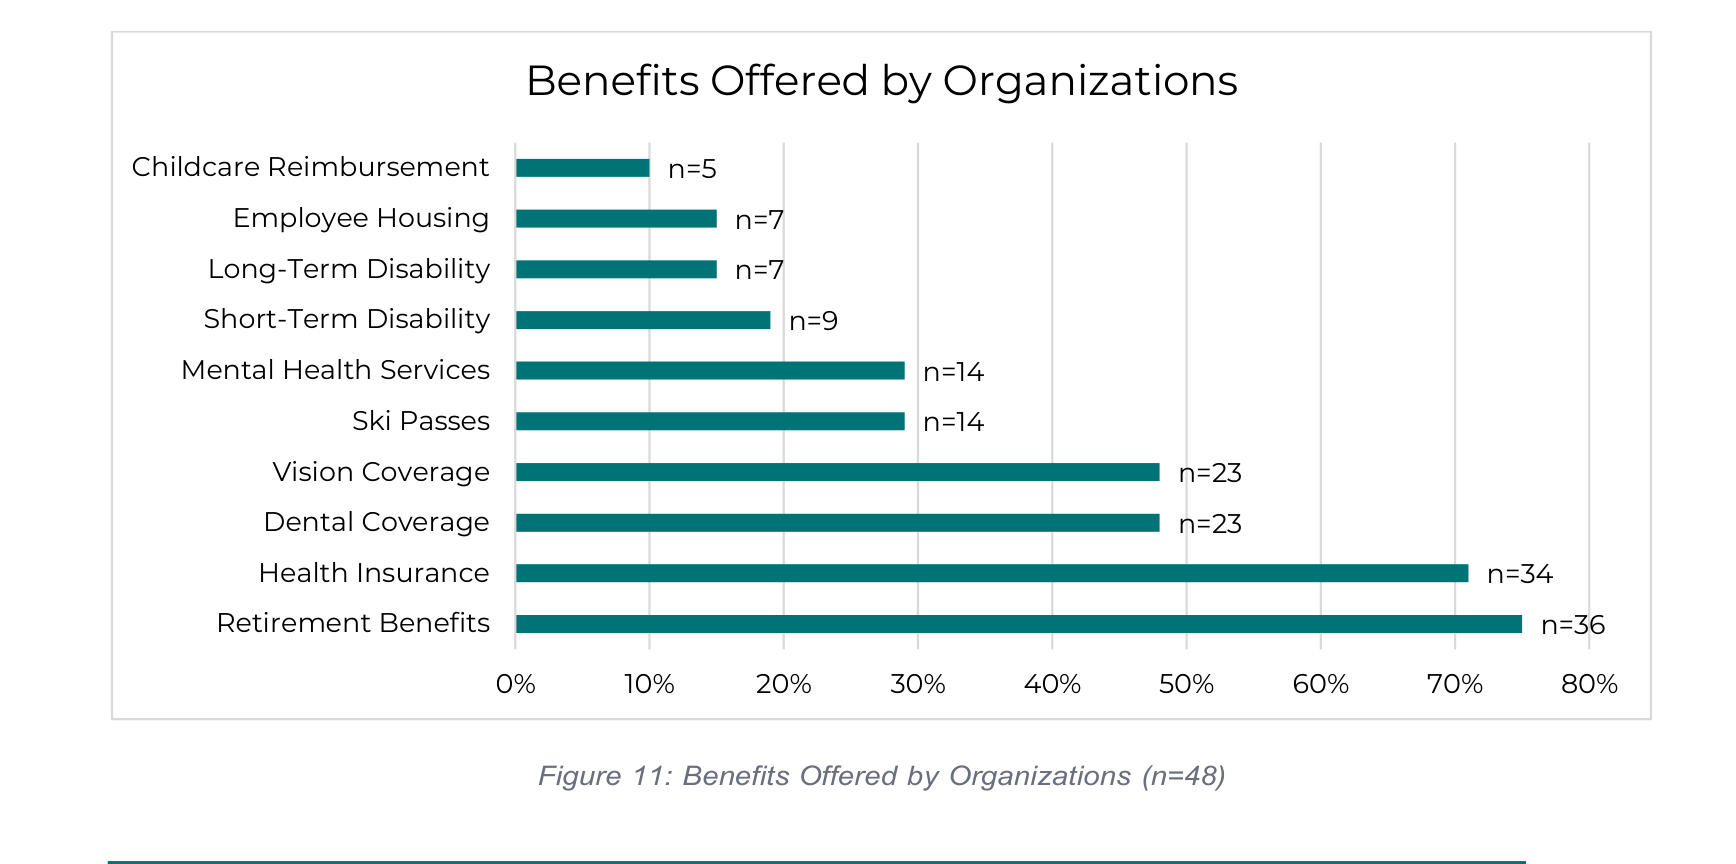
Compared to 2022: Retirement benefits saw the largest jump (59% → 75%). Health insurance also increased (67% → 71%). The 2026 survey also captures benefits not tracked in 2022 including ski passes (29%), mental health services (29%), and childcare reimbursement (10%)
Health Insurance
71% of organizations offer health insurance, up from 67% in 2022. Among those offering insurance, the coverage models vary significantly:
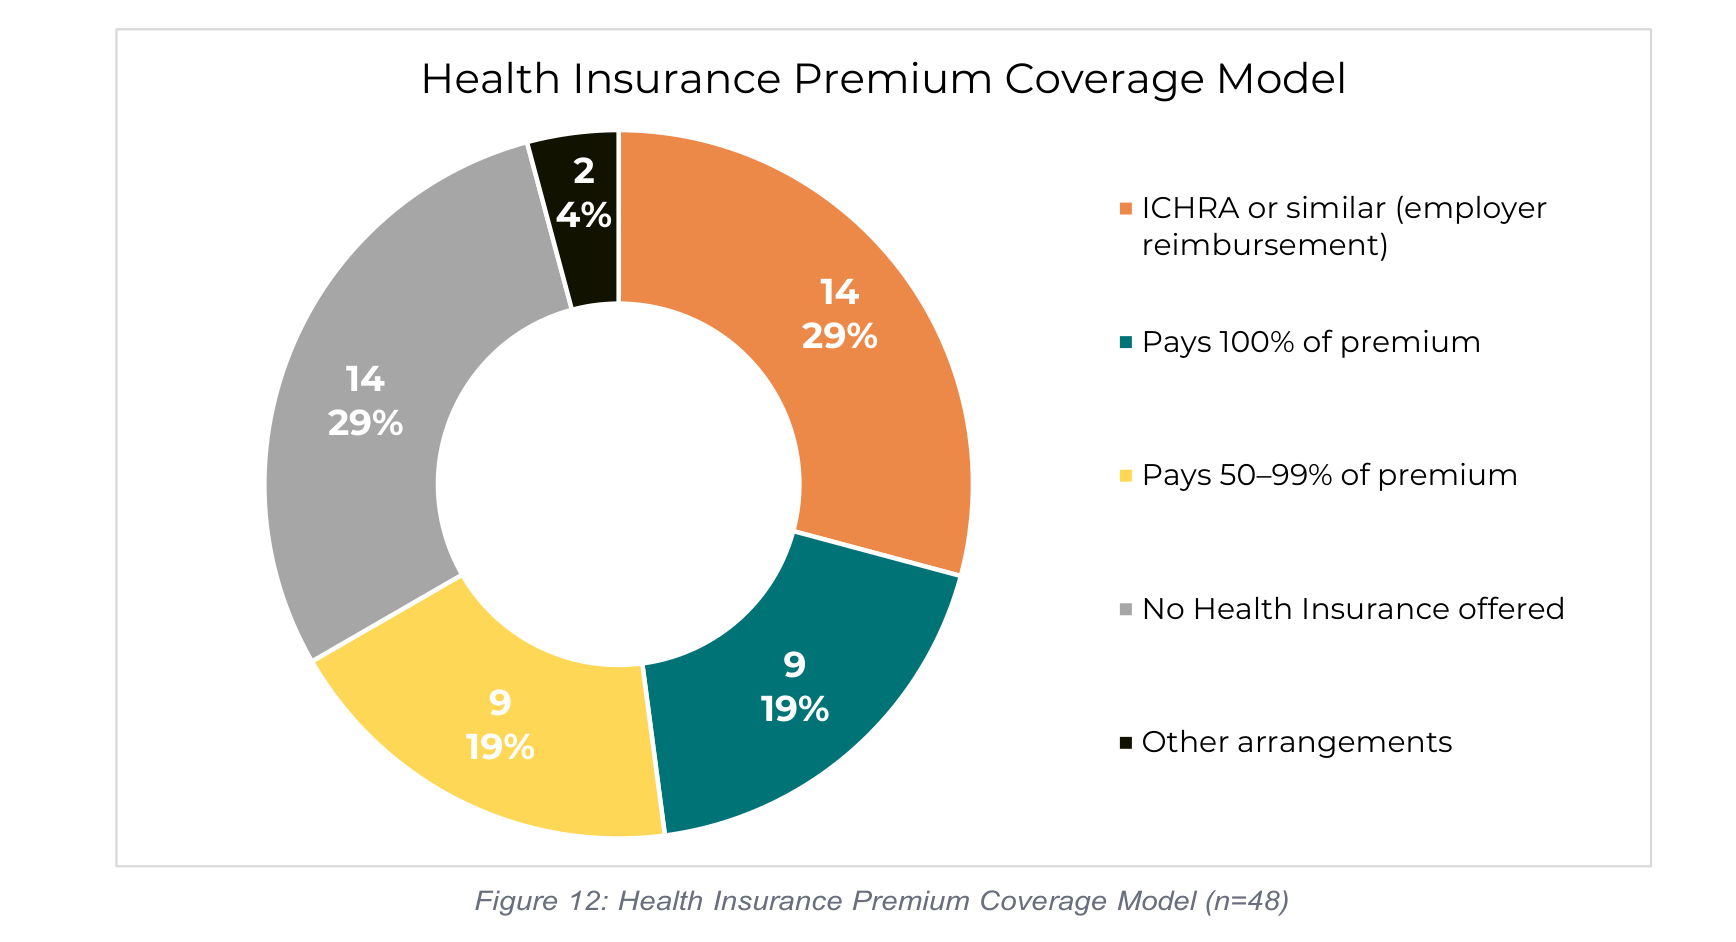
The rise of ICHRA
The emergence of ICHRA (Individual Coverage Health Reimbursement Arrangements) is the most significant shift since 2022. 41% of insured organizations now use ICHRA or similar models, up from approximately 5%. While
ICHRA offers flexibility and less employer burden, employees bear more responsibility for navigating plan selection.
Other Insurance & Benefits
• 48% offer dependent/spouse coverage; 21% cover domestic partners
• 48% offer dental plans (up from ~33%); 48% offer vision (up from ~44%)
• 19% offer short-term disability; 15% offer long-term disability
Retirement Benefits
75% of organizations offer retirement benefits (up from 59% in 2022). 83% of those offer employer matching, most commonly at 3%. Plans include 401(k), 403(b), SIMPLE IRA, and SEP IRA.
Employee Housing
15% of organizations offer employee housing, a critical recruitment tool in mountain communities. Models range from subsidized seasonal units (~$500/month) to on-site caretaker residences.
Paid Time Off & Leave (PTO)
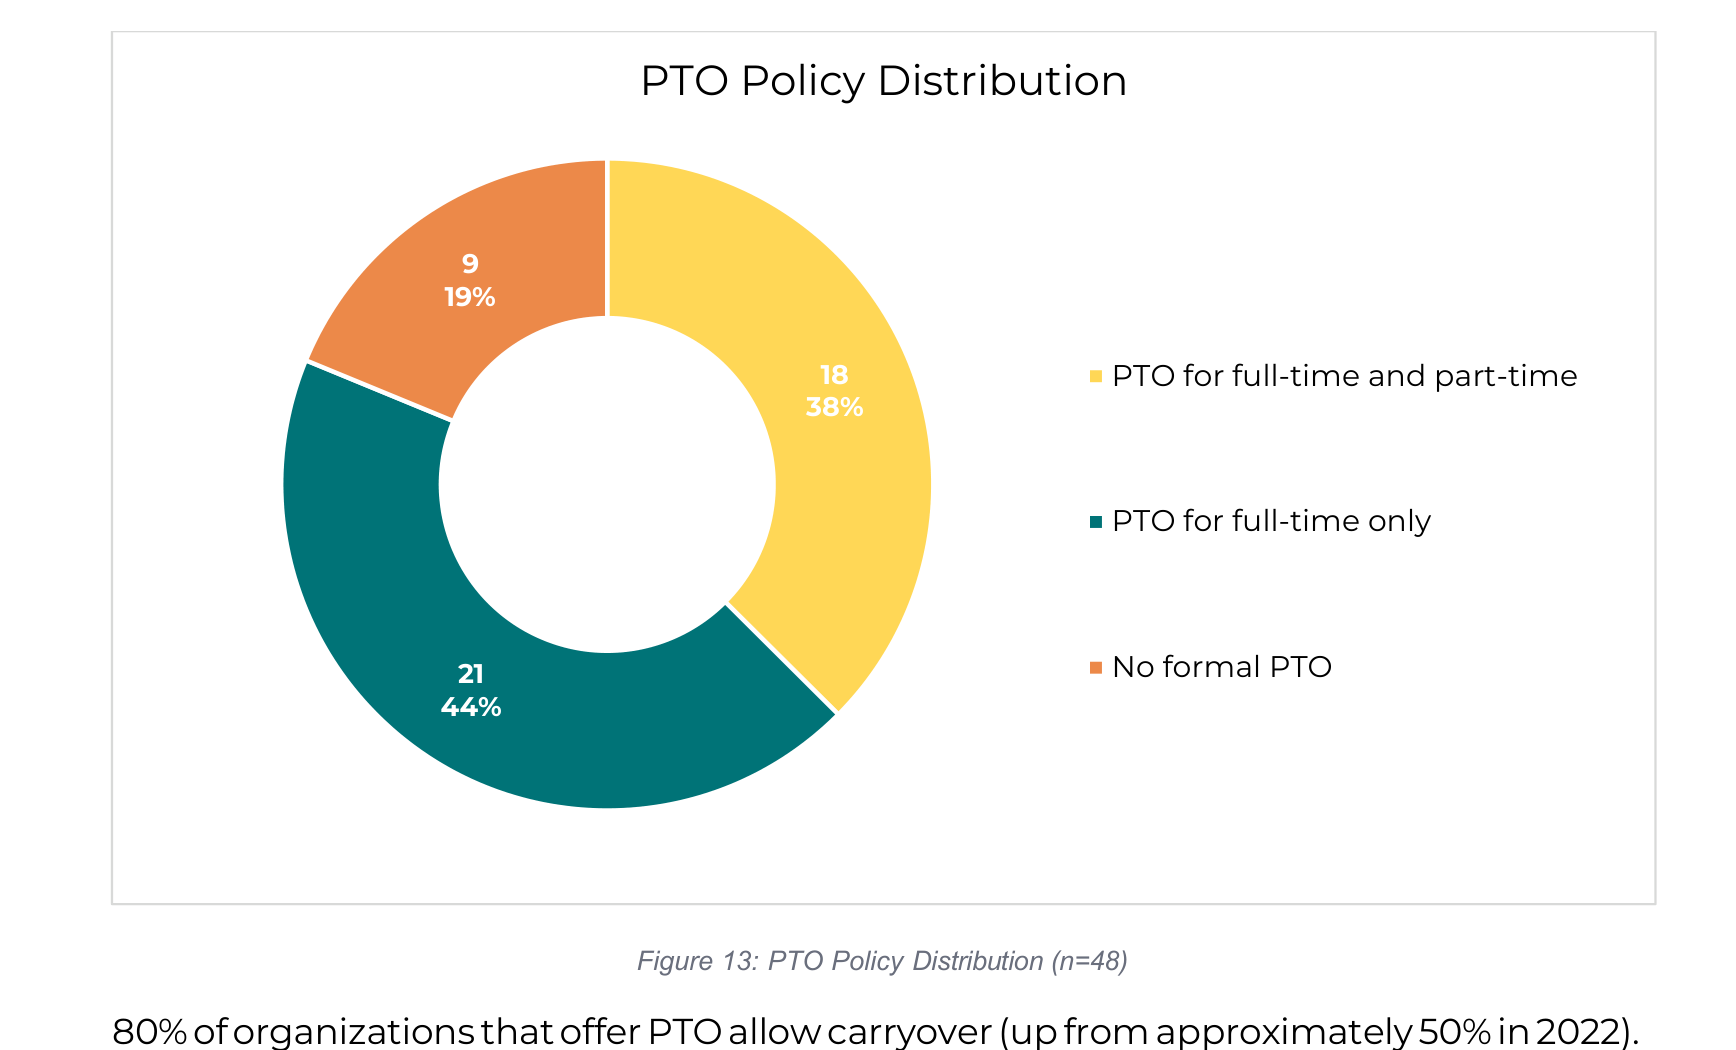
80% of organizations that offer PTO allow carryover (up from approximately 50% in 2022). 58% track sick time separately from PTO.
Family Leave
New data for 2026. Colorado's FAMLI (Family and Medical Leave Insurance) program launched in 2024, providing a baseline of paid leave. Nonprofits are still formalizing how they supplement or layer their own policies on top of FAMLI.
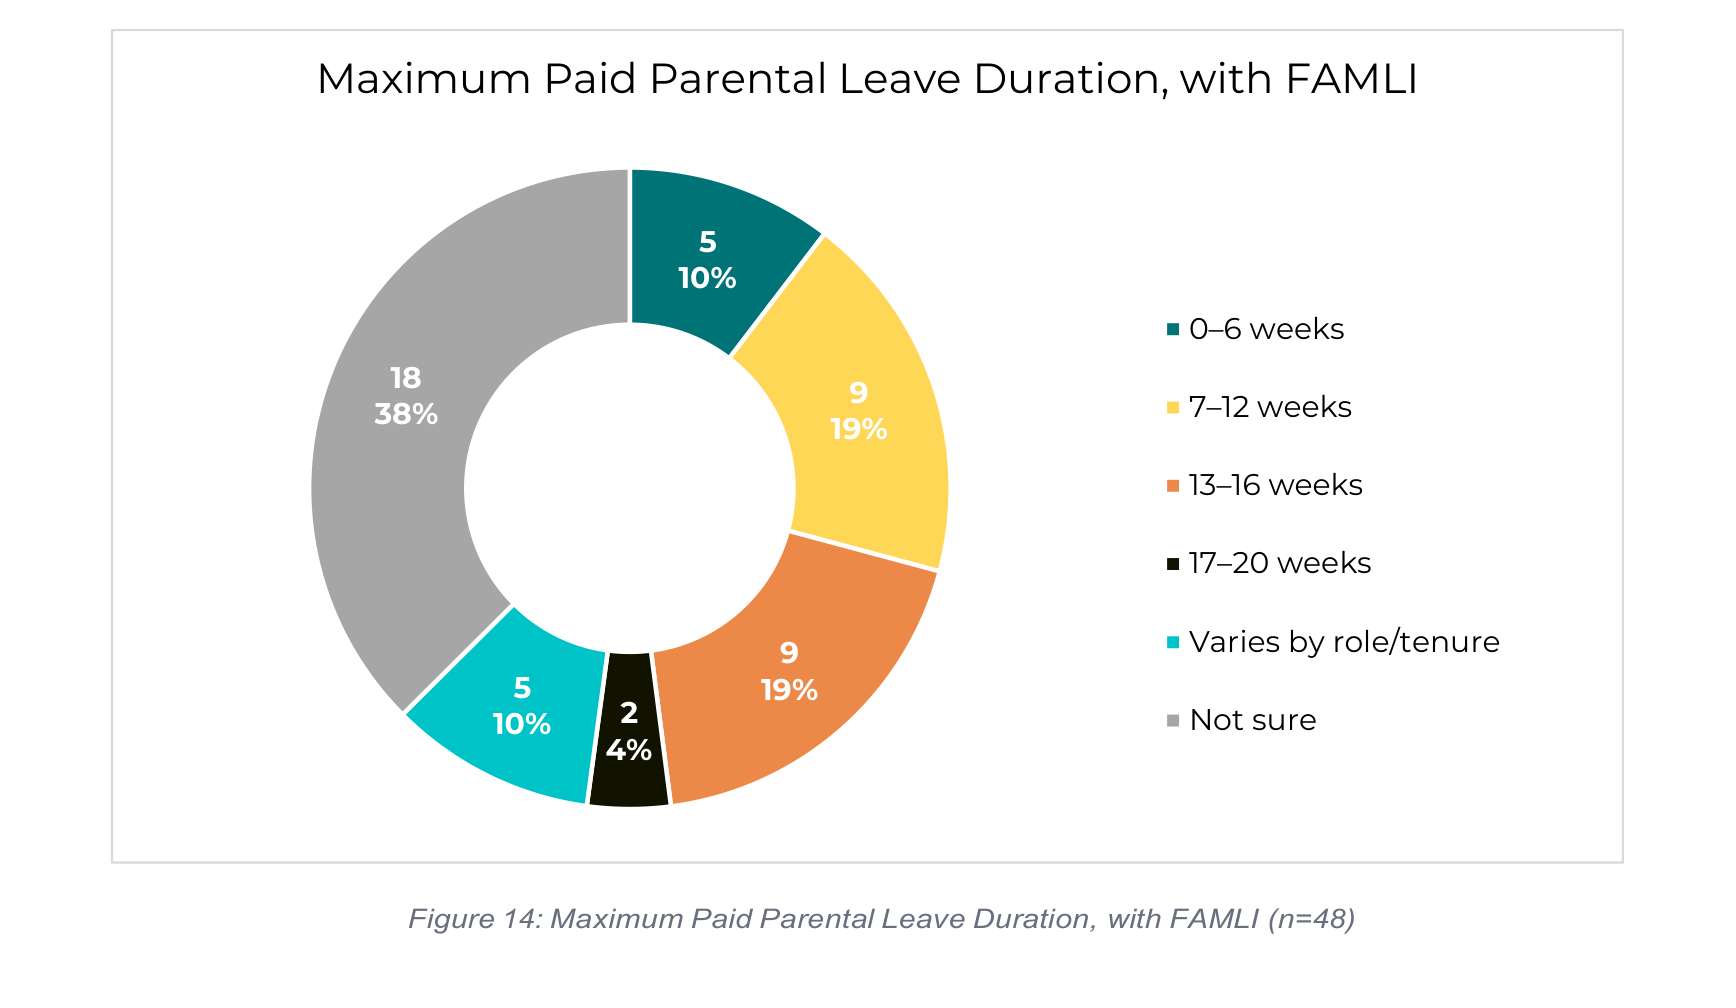
The high "Not sure" rate (38%) suggests many organizations have not yet formalized parental leave policies in the context of FAMLI. Among those with defined policies, 7–16 weeks is most common.
Staffing Impact
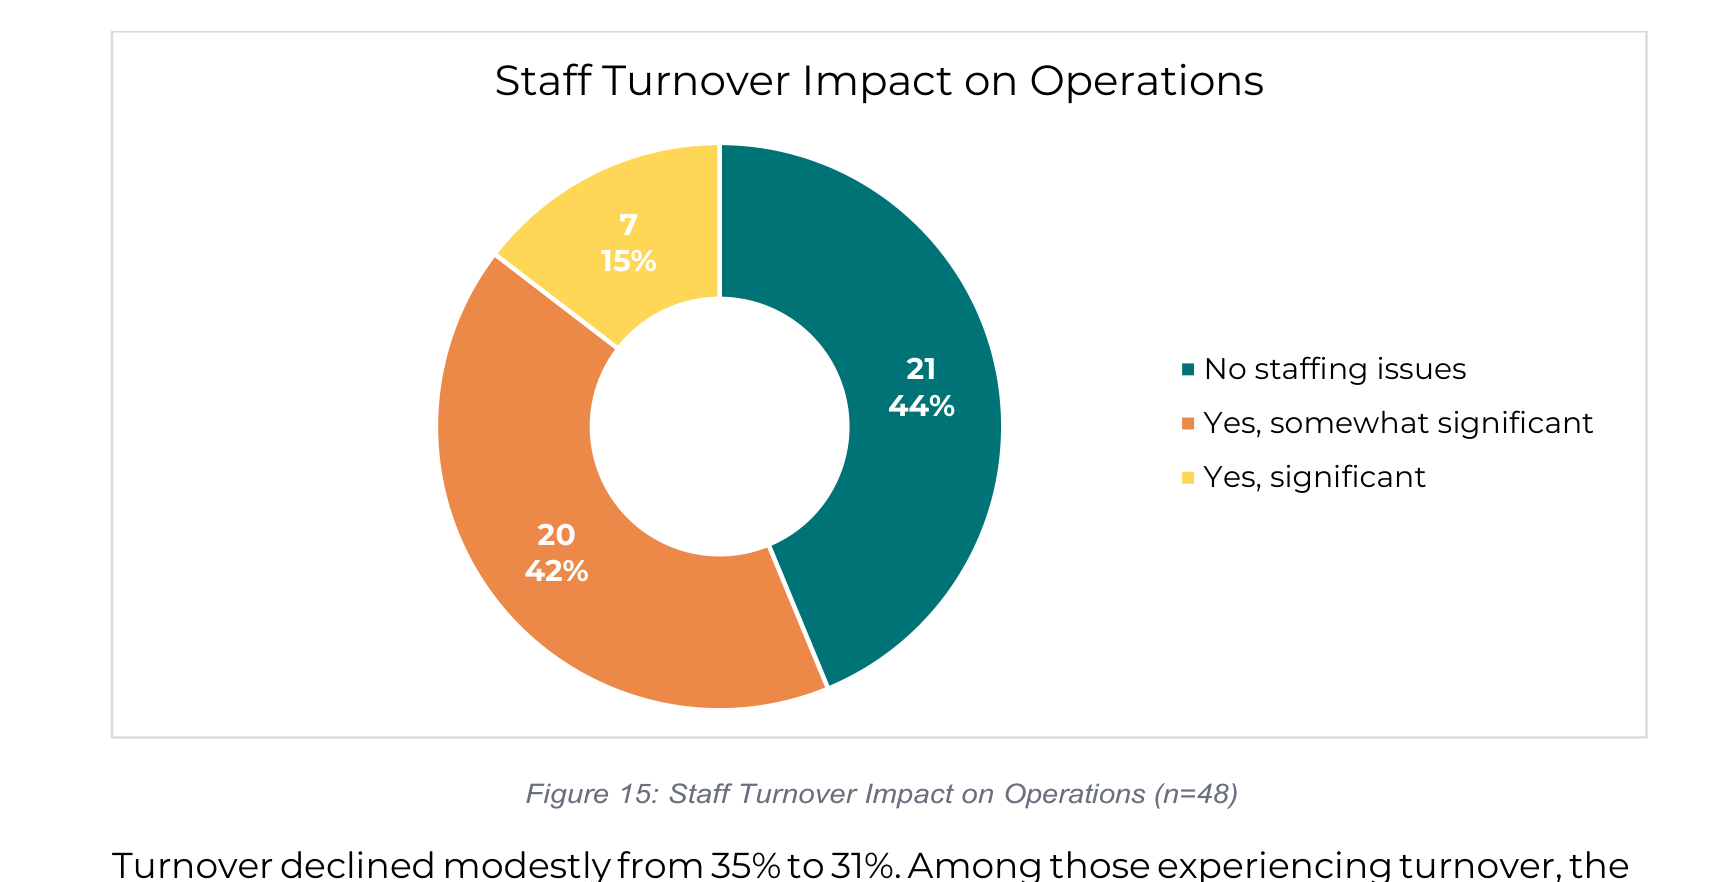
Turnover declined modestly from 35% to 31%. Among those experiencing turnover, the reasons have diversified since 2022:
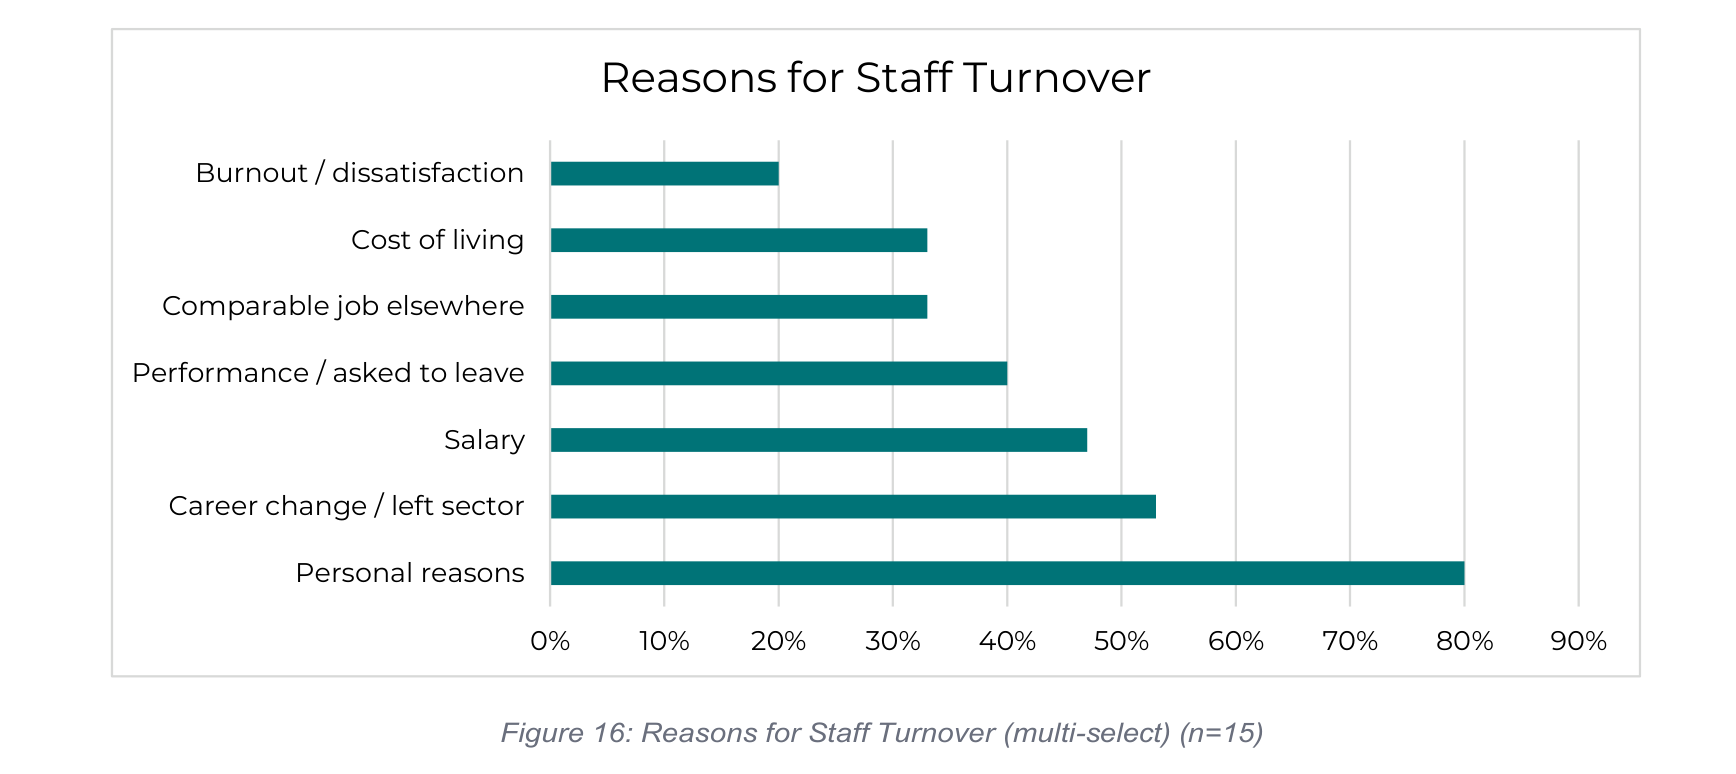
In 2022, "people leaving the county" was the dominant driver of turnover at 60%. By 2026, the reasons are more distributed, led by personal reasons, career changes, and salary.
Staff Tenure
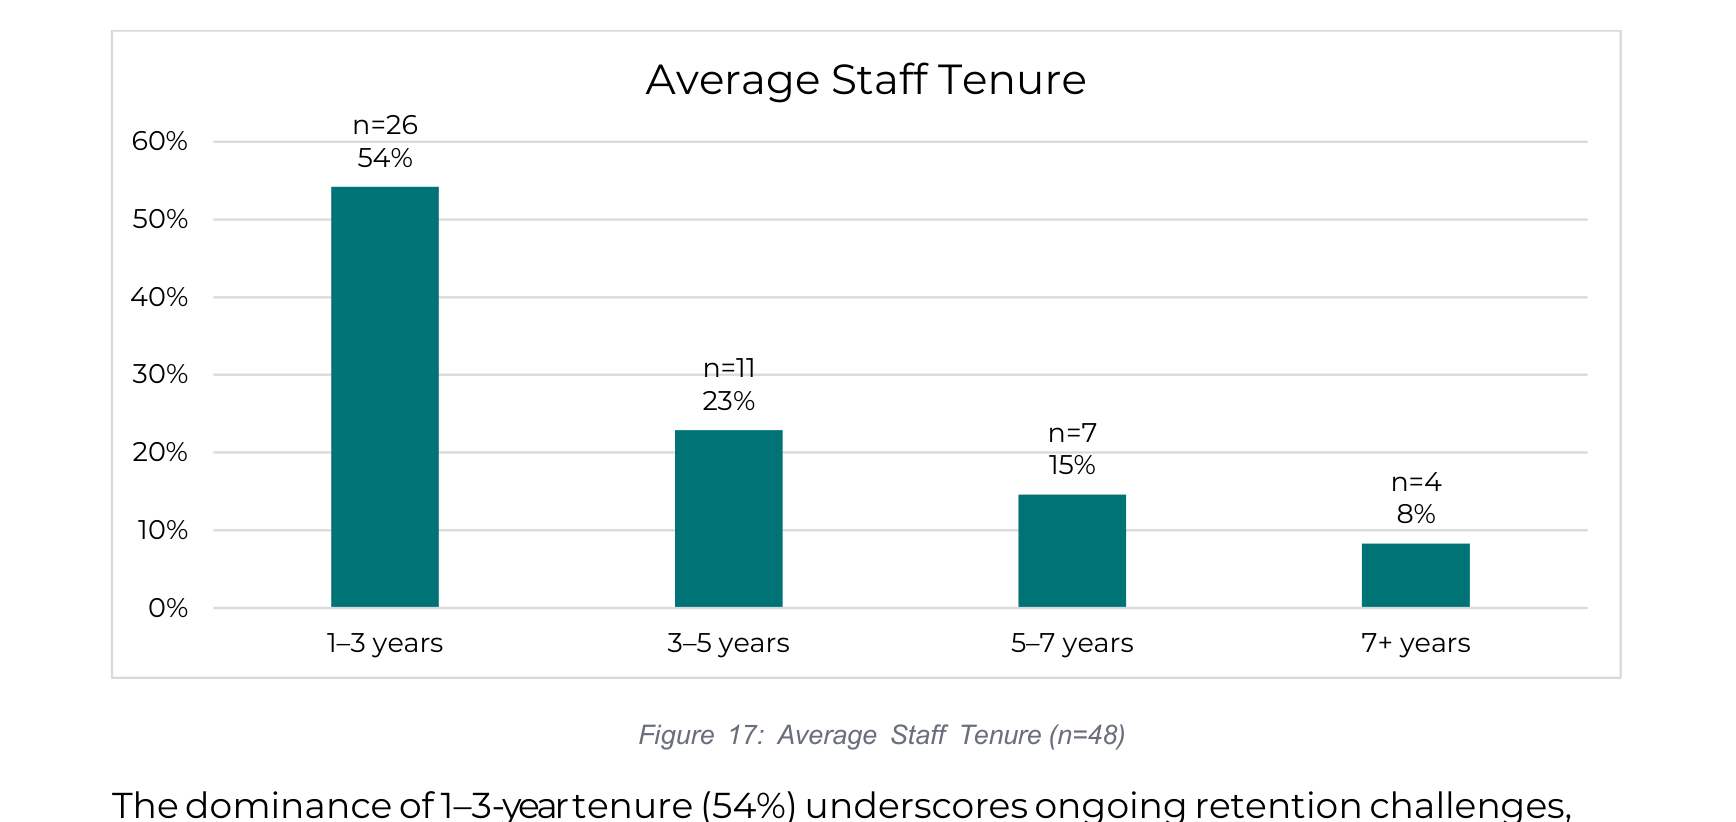
The dominance of 1–3-year tenure (54%) underscores ongoing retention challenges, though 23% report average tenure of 5+ years.
Flexible Scheduling
96% of responding organizations offer some form of flexible scheduling. This near-universal adoption represents one of the most significant structural changes to nonprofit work life since 2022.
Survey respondents provided rich qualitative feedback. Five major themes emerged across their comments.
<h3>Theme 1: Cost of Living Remains the Defining Challenge</h3>
The most pervasive theme is the persistent gap between nonprofit salaries and the cost of living in mountain communities. Housing costs are the most frequently cited specific pressure. Multiple respondents referenced the need to reach a "livable wage" of approximately $24/hour as a minimum floor.</br>
<h3>Theme 2: Creative Compensation Strategies are Emerging
Nonprofits</h3> <br>are turning to creative strategies: comprehensive wage analyses with mid-point adjustments, employment agreements with ratification bonuses, unlimited PTO policies, wellness benefits, housing assistance, and extended holiday closures.</br>
<h3>Theme 3: Small Organizations Face Disadvantages</h3>
Smaller organizations describe cascading challenges: limited budgets constrain salaries, low salaries make benefits difficult to fund, lack of benefits drives turnover, and turnover disrupts service delivery. Several are working to transition from all-contractors to W-2 models.
<h3>Theme 4: The Sector is Professionalizing
Organizations</h3> report conducting formal wage analyses, implementing structured retention strategies, adopting 4-day workweeks, investing in leadership development pipelines, and using data-driven approaches. One large organization (annual budget over $2M) reduced voluntary turnover from 39% to 24% through strategic wage investments.</br>
<h3>Theme 5: Housing as a Workforce Tool</h3>
Seven organizations (15%) now offer employee housing. For those that can provide it, housing has become one of the most powerful recruitment tools.
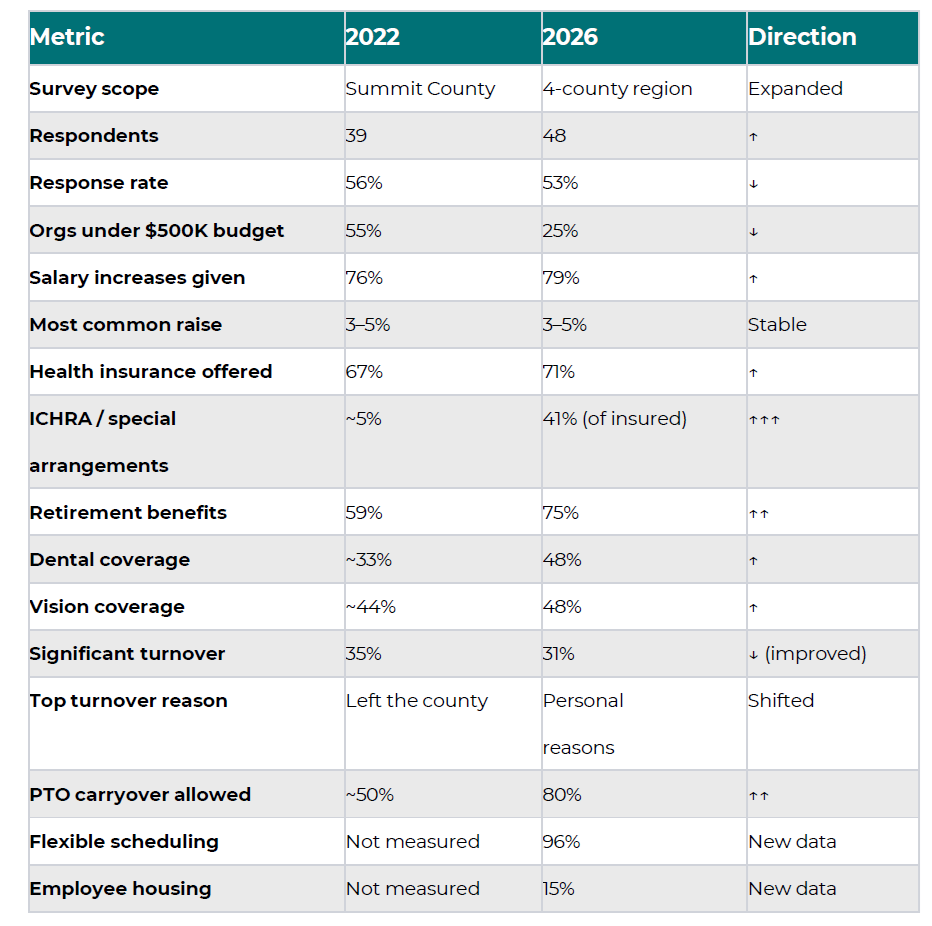
The following table provides a comprehensive side-by-side comparison of the 2022 and 2026 survey findings. This view is designed to serve as a quick-reference benchmark for nonprofit leaders assessing where the sector has moved and where challenges persist.
Benefits & Organization Size
This section examines how the availability of health, dental, and vision insurance benefits varies with organizational size, measured both by annual budget and by full-time employee (FTE) count. The data reveals a strong and consistent relationship: larger organizations are considerably more likely to provide all three types of insurance coverage.
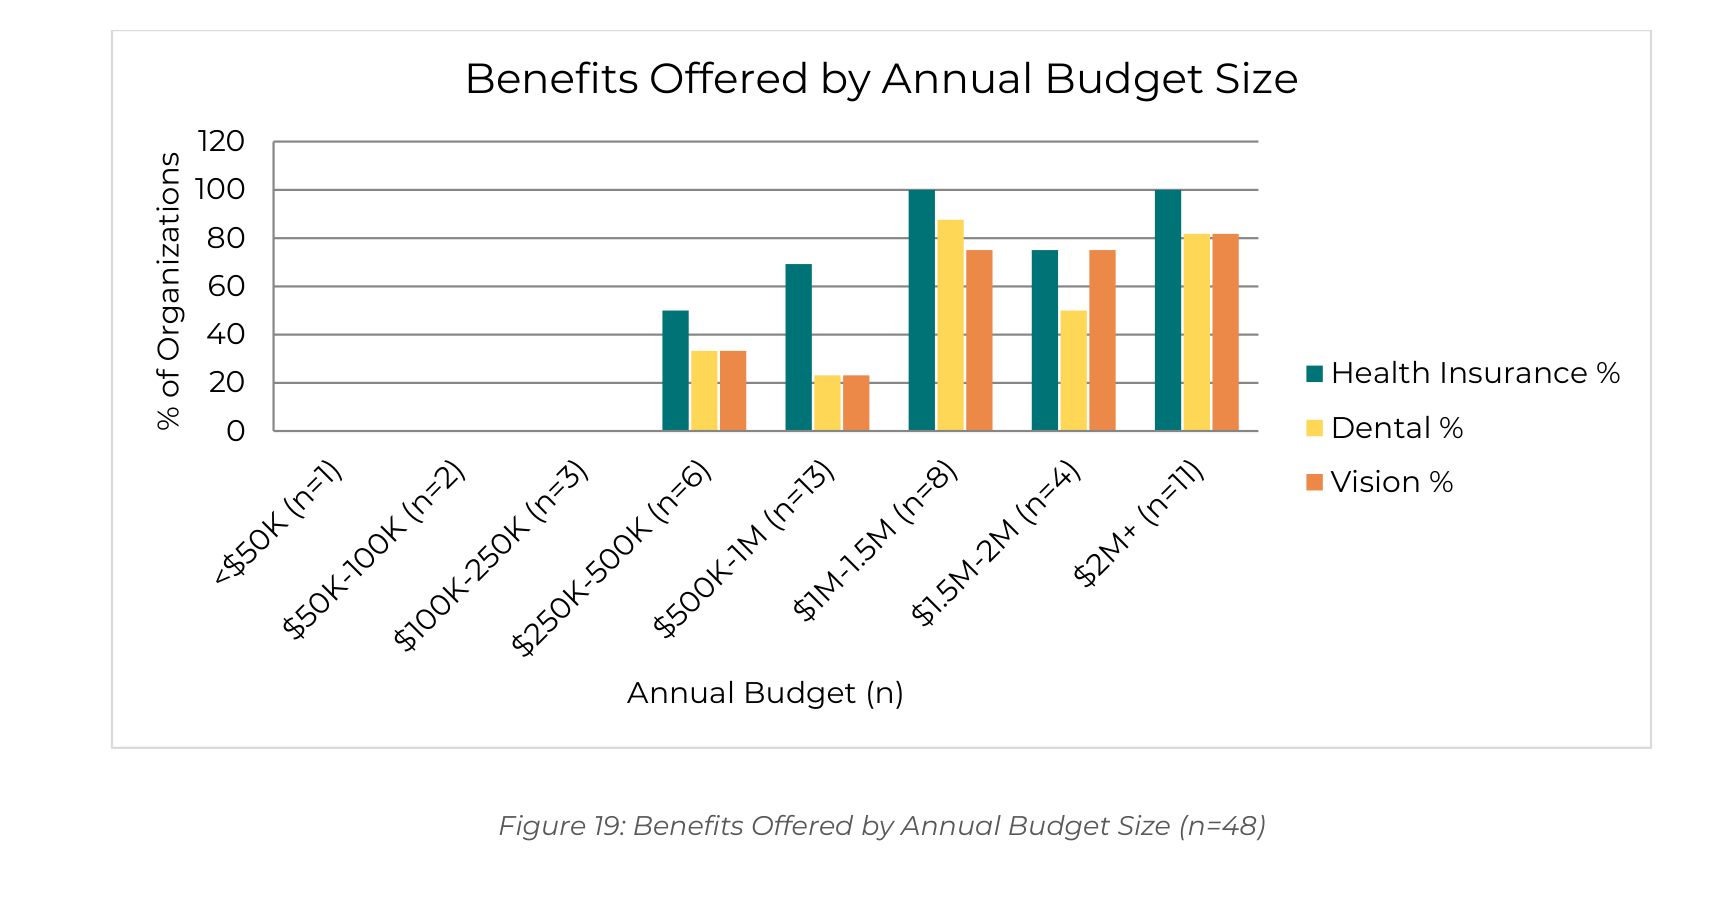
Benefits by Annual Budget Size
Figure 19 illustrates the percentage of organizations offering health, dental, and vision insurance across eight budget categories. The trend is clear: benefit availability scales sharply with budget. Among organizations with budgets under $250K, none of the respondents offered health, dental, or vision insurance. At the $250–$500K tier, 50% offered health insurance and approximately one-third offered dental or vision coverage. By contrast, every organization with a budget over $1M offered health insurance, and the majority offered dental and vision as well.
Benefits by Full-Time Employee (FTE) Count
Figure 20 shows the same benefit analysis segmented by the number of FTEs. The relationship mirrors the budget analysis: benefit adoption increases steadily as organizations grow. Notably, organizations with 11 or more FTEs show health insurance adoption above 70%, while dental and vision coverage become common only among organizations with 11–20 or more FTEs.
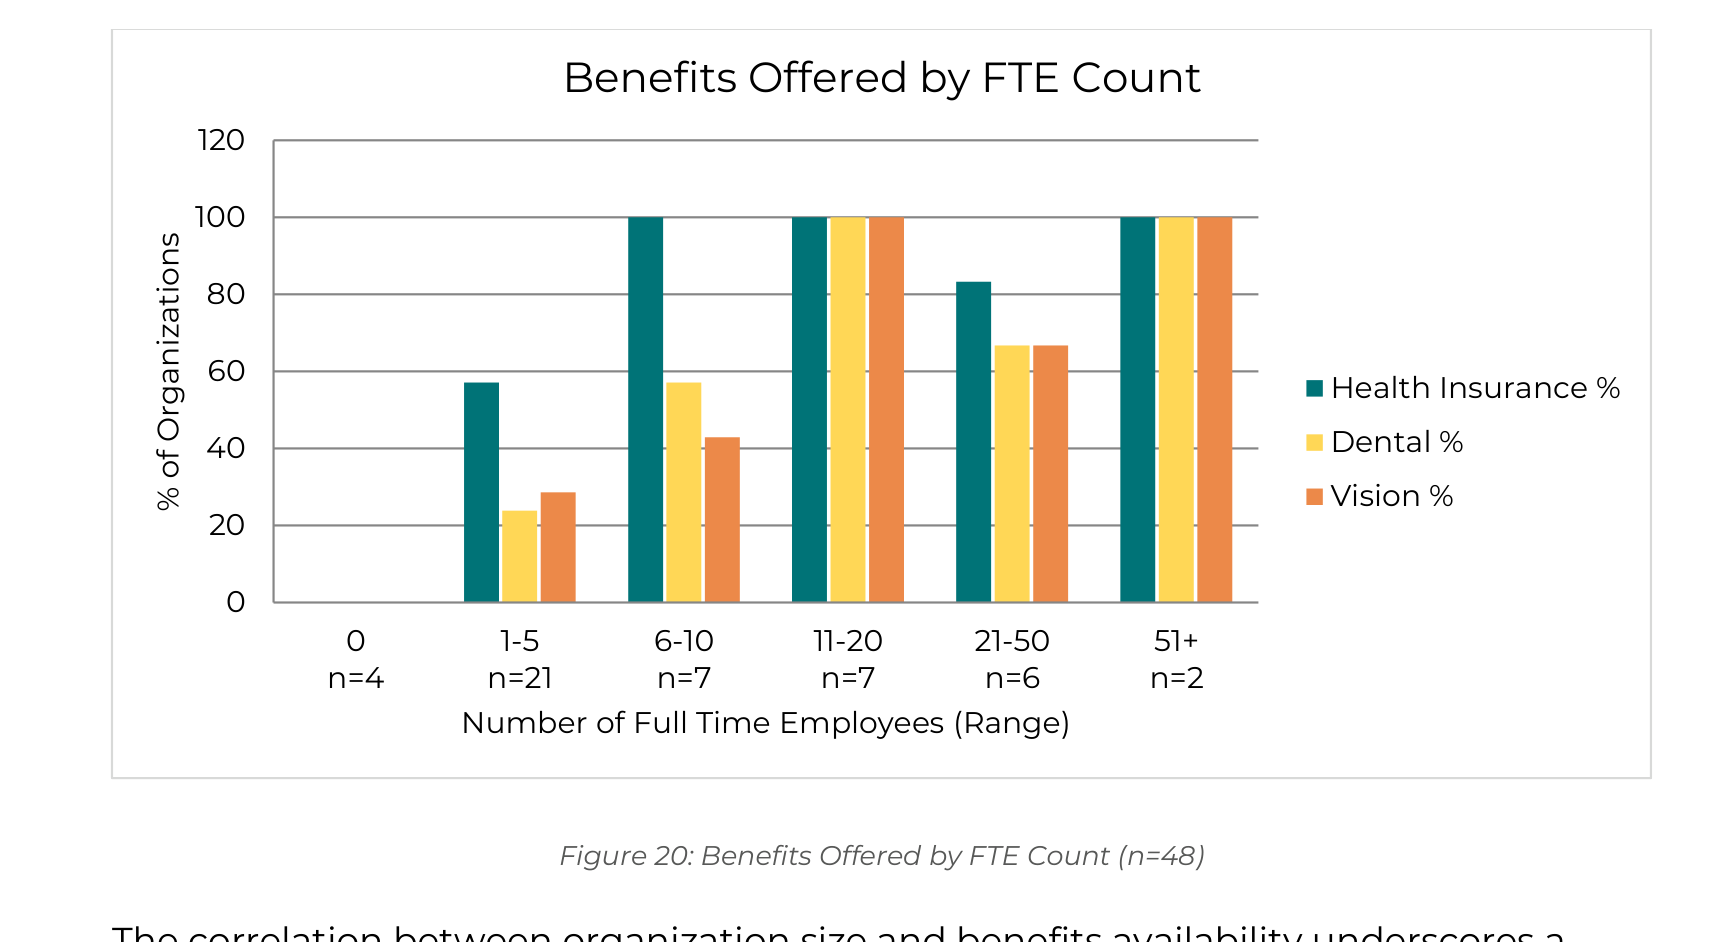
The correlation between organization size and benefits availability underscores a well-known challenge: small nonprofits, which represent 25% of survey respondents by budget, operate with limited capacity to offer employee benefits.
Employee Salaries and Organization Size
Compensation levels across all positions are closely tied to organizational size. This section explores how median salaries vary across budget tiers and employee count, highlighting significant pay differentials between small, mid-sized, and large nonprofits.
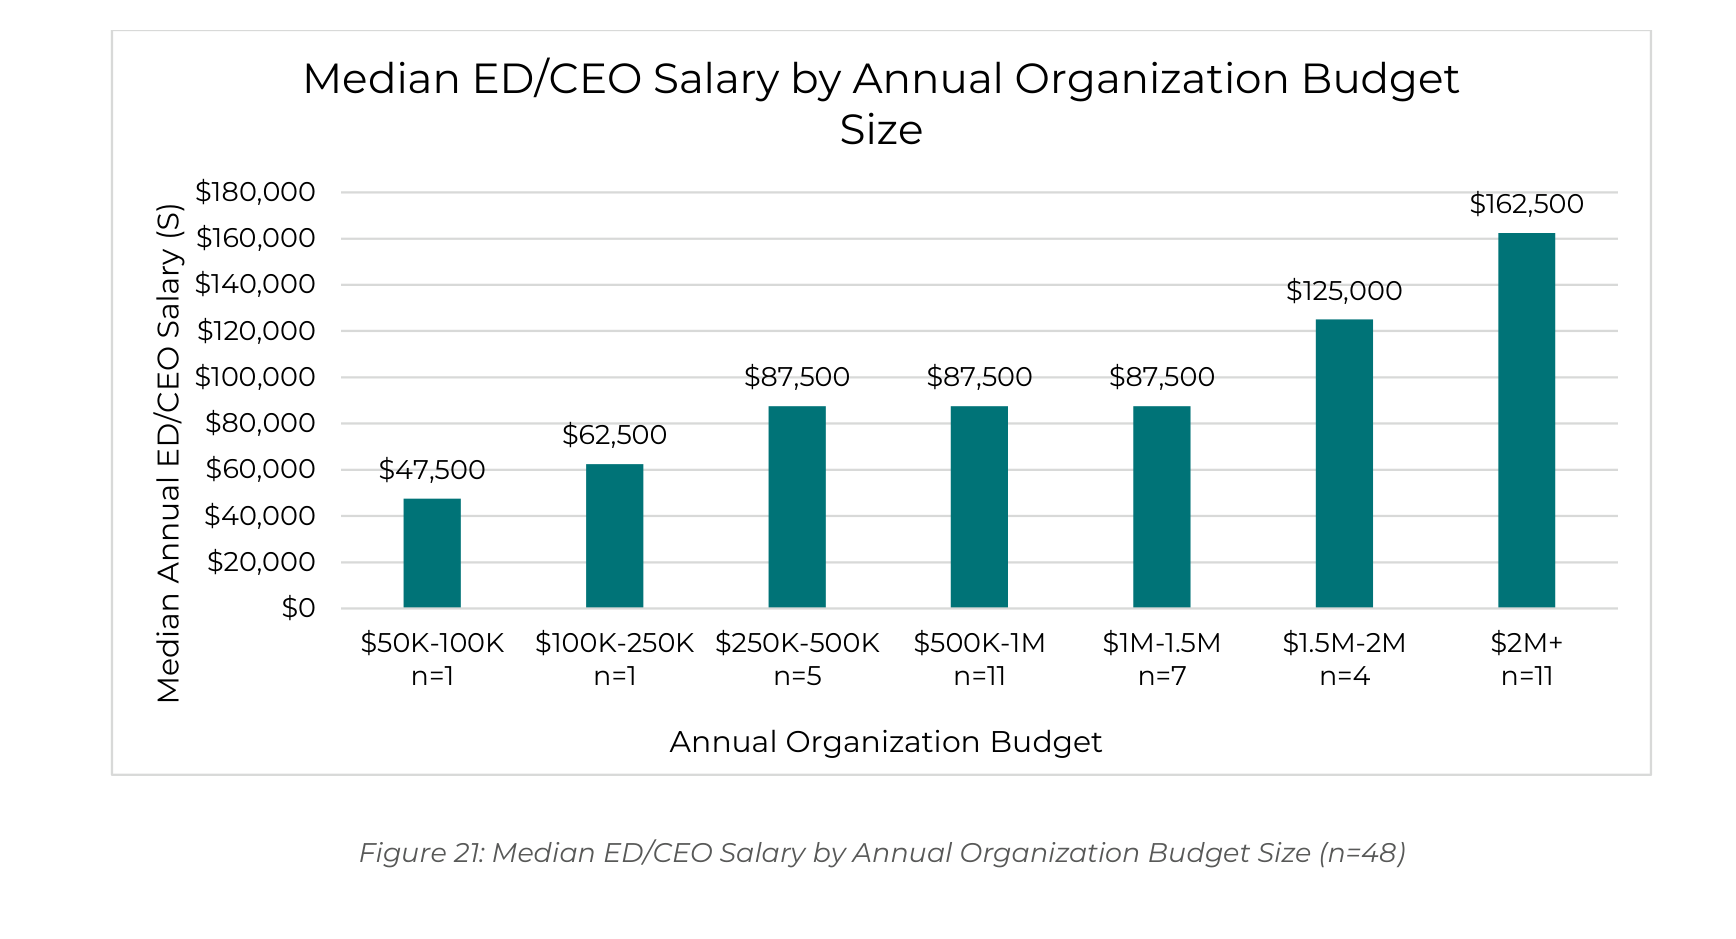
Executive Director (ED) Salary by Budget Size
Figure 21 shows the median ED/CEO annual salary at each budget tier. ED compensation rises from roughly $75K at mid-size organizations to over $150K at the largest. Organizations with budgets over $2M reported median ED salaries approximately 65–80% higher than those with budgets under $500K.
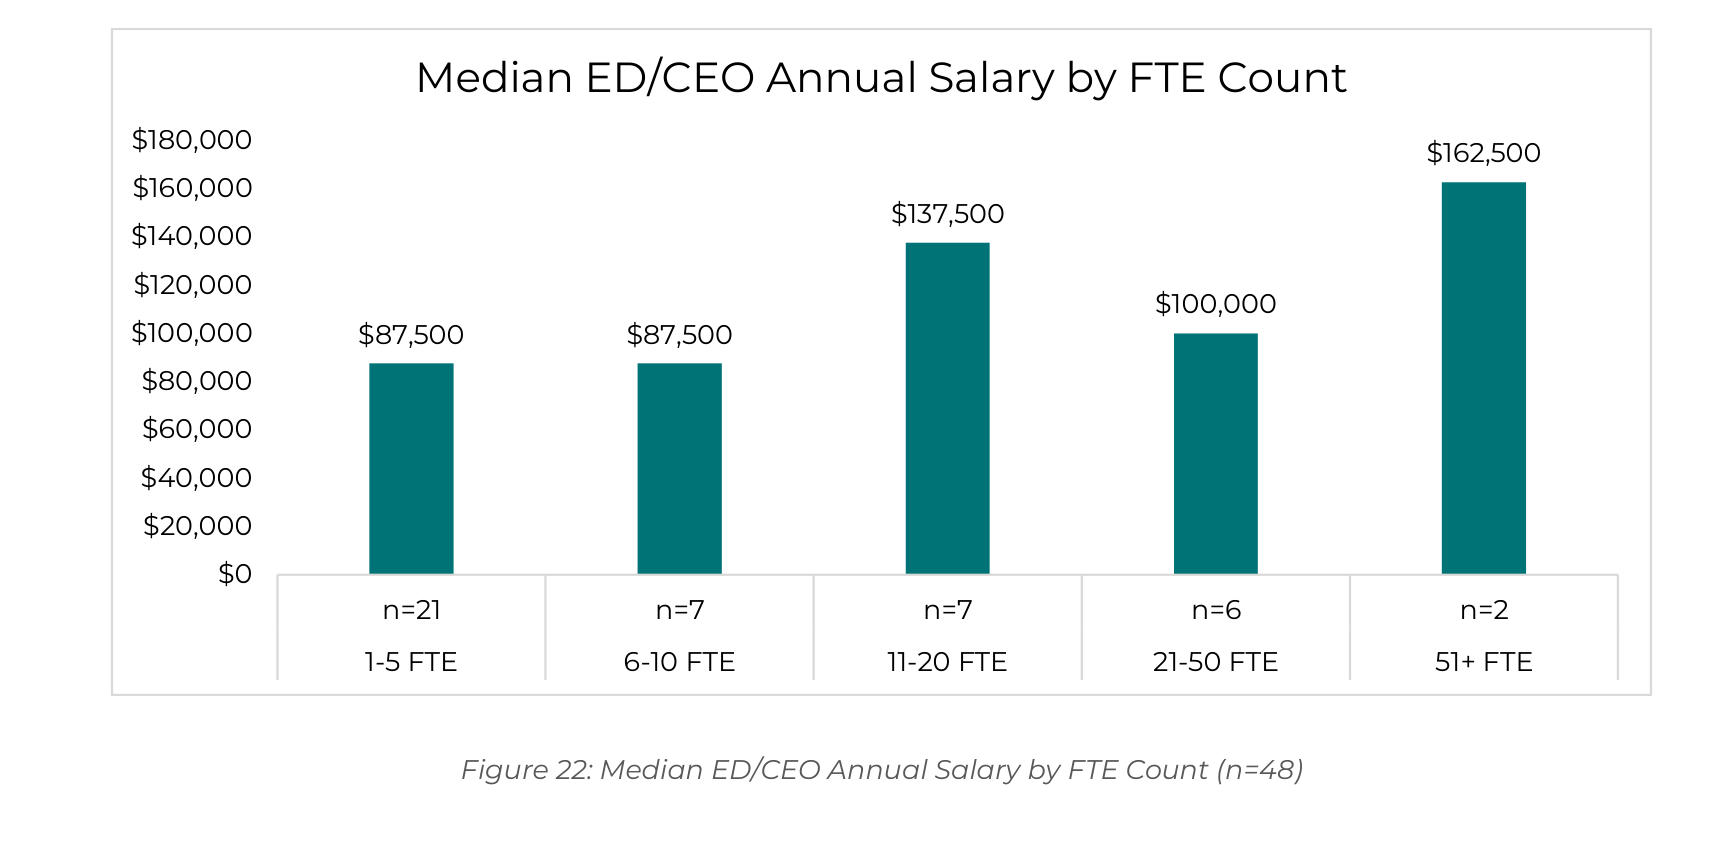
Executive Director (ED) Salary by Full Time Employee (FTE) Count
Figure 22 shows the same analysis segmented by FTE count. Organizations with 51 or more FTEs pay their ED a median salary that is substantially higher than smaller organizations, likely consistent with the greater complexity and scope of these roles.
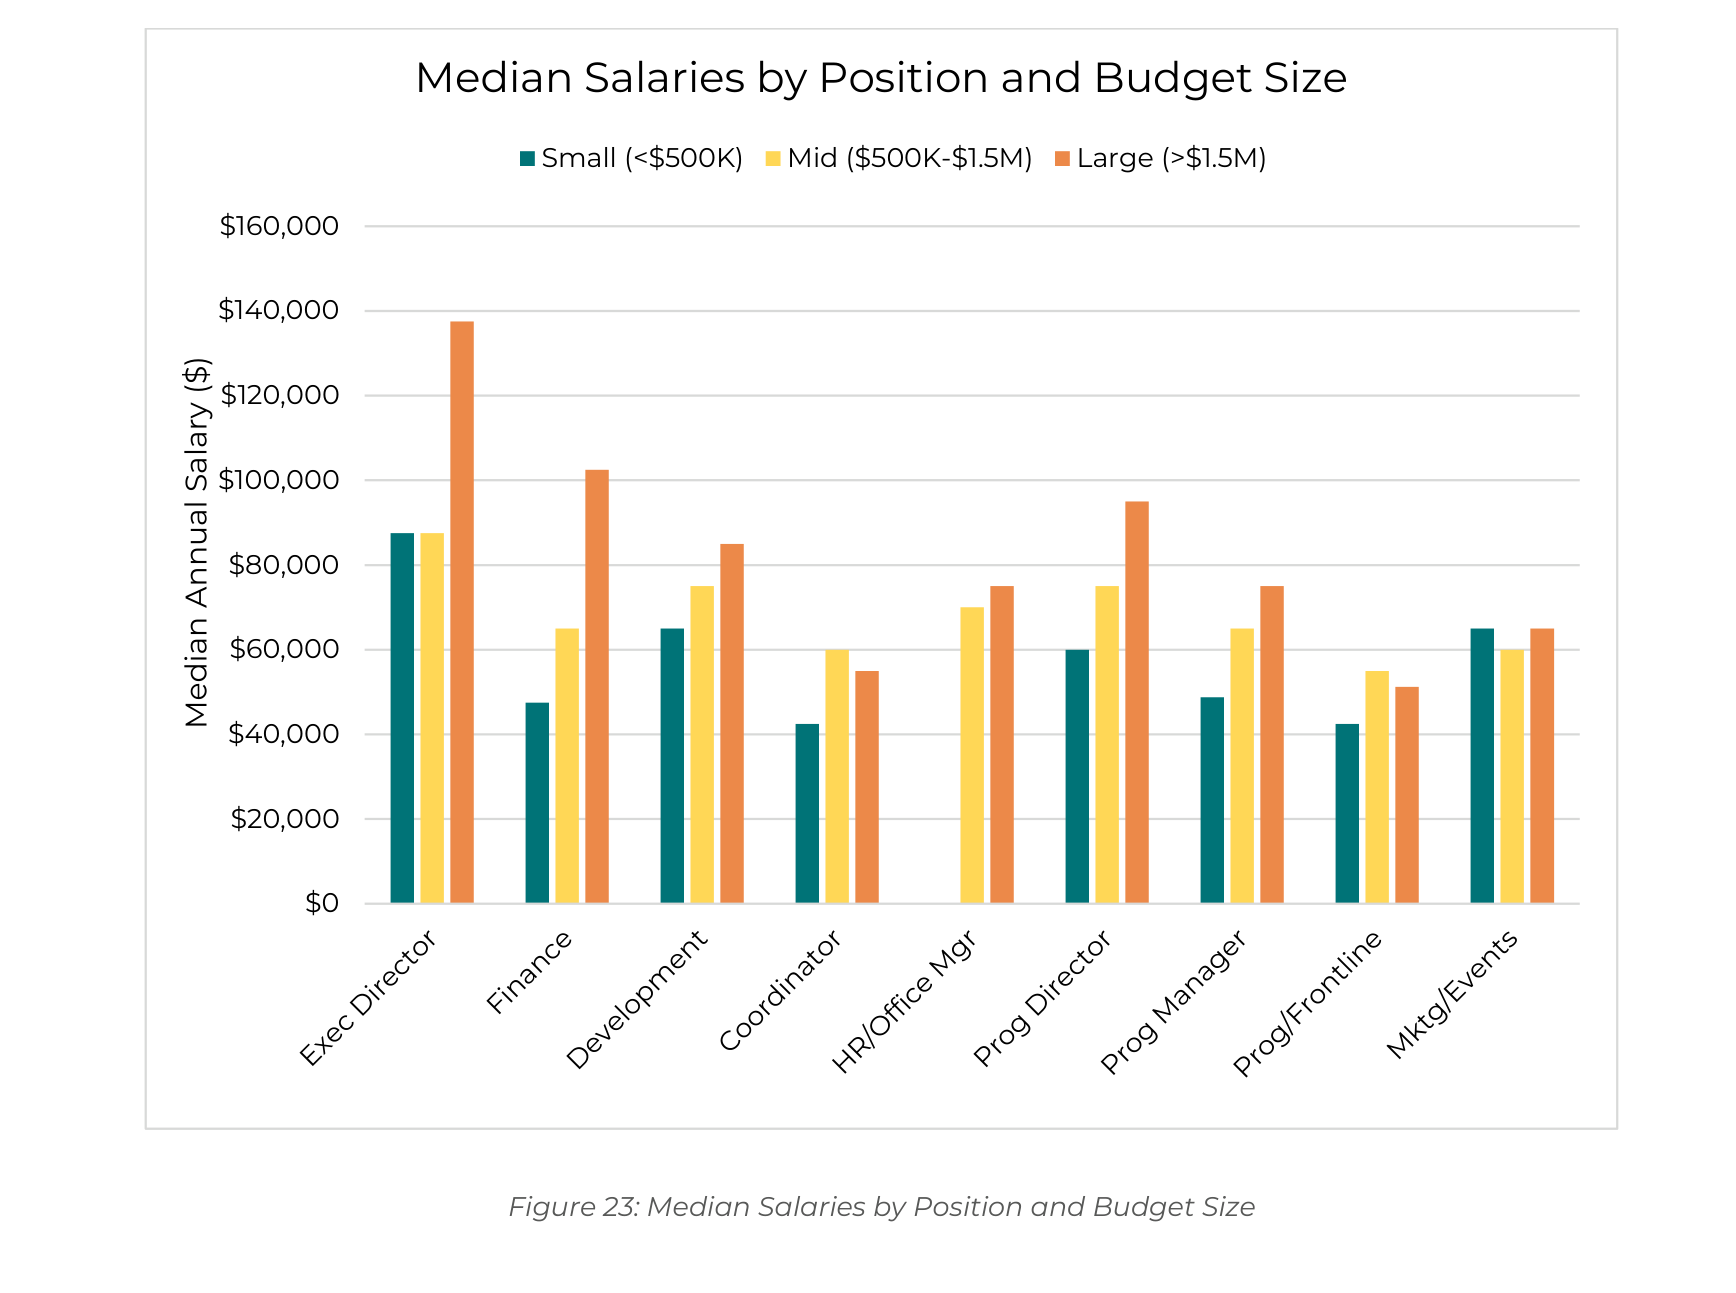
All Positions: Salary by Budget Size
Figure 23 presents median salaries across nine common positions, broken into three broad budget groupings: small organizations (under $500K), mid-size ($500K–$1.5M), and large (over $1.5M). Across virtually every position, large organizations pay meaningfully more than smaller ones. The pay gap is most pronounced for the executive director, finance employee and program director, where large organizations pay 30–40% more than their smaller counterparts. There were no respondents with budgets under $500K that had an HR/Office Manager position.
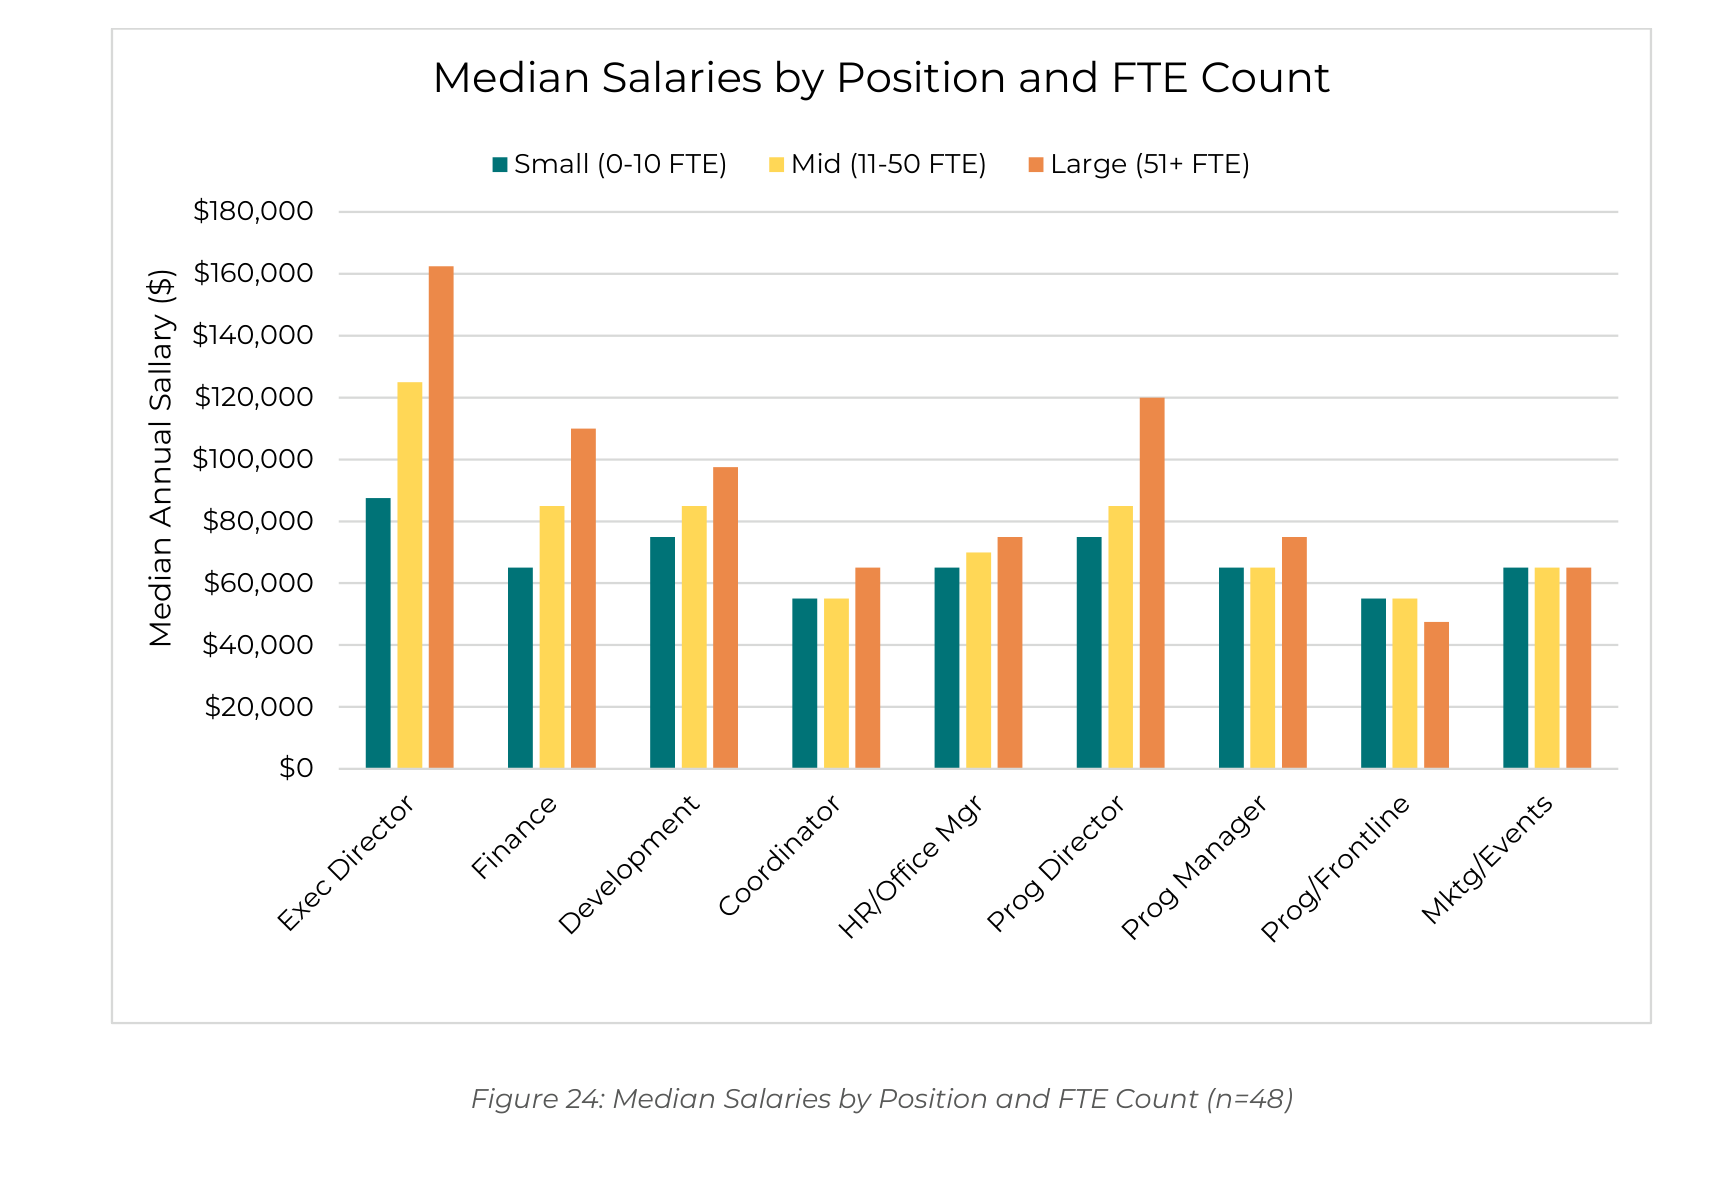
All Positions: Salary by Full-Time Employee (FTE) Count
Figure 24 presents the same position-level analysis broken down by FTE count (Small = 0–10 FTE, Mid = 11–50 FTE, Large = 51+ FTE). The pattern is consistent: larger organizations offer higher median compensation across all roles, with the salary differential being particularly visible for executive leadership and program director positions.
Survey respondents were asked not only what their current employees earn in each role, but also what starting salary they would offer if they were hiring for that same position today. This question was asked to account for tenure-based salary accumulation, but the comparison may also reveal where organizations feel their current compensation is competitive, where it lags behind market expectations, and where they are being intentional about raising starting pay to attract new talent.
Figure 25 compares the median current salary and the median “would offer today” starting salary across nine common nonprofit positions. Several noteworthy patterns emerge:
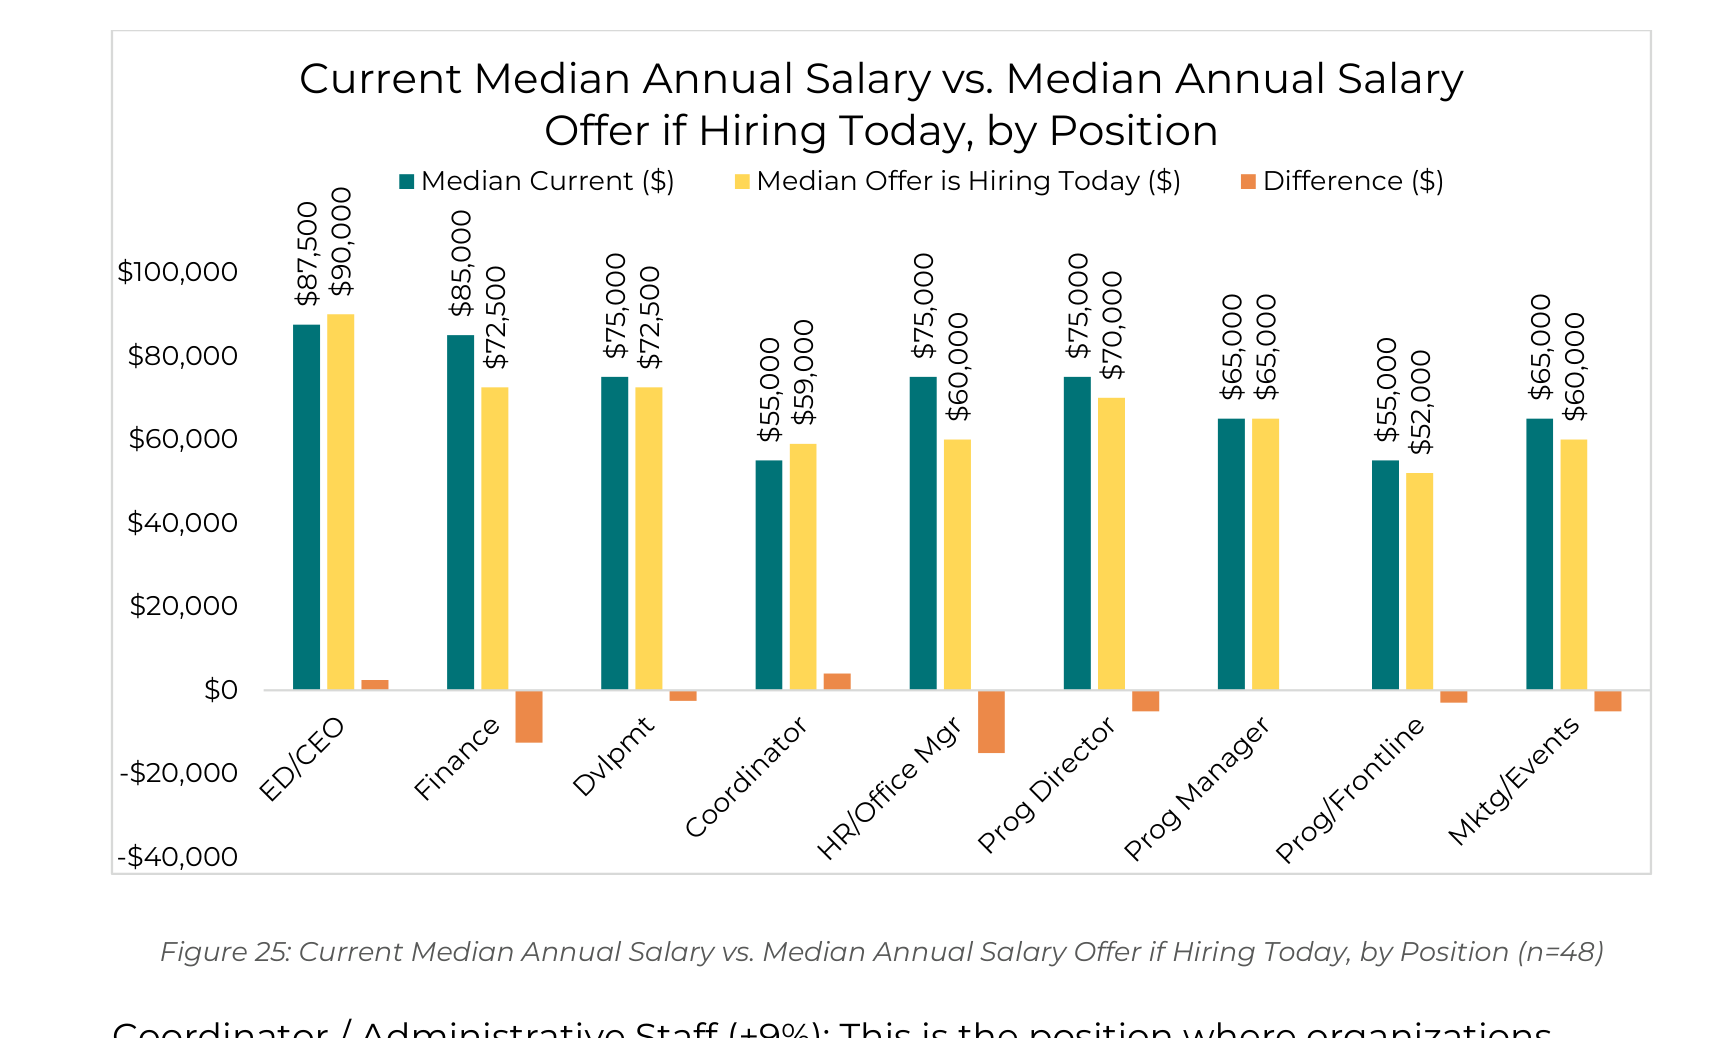
Coordinator / Administrative Staff (+9%): This is the position where organizations most commonly indicated they would offer a meaningfully higher starting salary than current staff earn, reflecting a recognition that administrative roles have historically been underpaid and that market competition for support staff is intensifying.
Executive Director (modest +3%): Organizations would offer only slightly more than current ED salaries, suggesting the market rate for executive leadership is broadly in line with current pay, though several respondents noted in open-ended comments that their ED compensation remains below what would be needed to attract candidates from outside the region.
Finance Staff (-15%) and HR/Office Manager (-20%): These positions show the largest downward gap, meaning organizations currently pay their incumbent staff more than they would offer a new hire. This may reflect tenure-based pay accumulation.
Program Director (-7%), Marketing/Events (-8%), and Development (-3%): These roles show modest downward adjustments in hiring intent, which may indicate that some organizations have over-invested in these positions relative to current market rates, that role definitions have shifted since incumbents were hired, or their current staff has accumulated tenure-based pay.
Program Manager (no change) and Program/Frontline Staff (-3%): These positions show the greatest stability between current and hiring salary, suggesting that compensation for frontline and program management roles is largely settled, and organizations aren't feeling pressure to adjust pay to attract or retain talent in these positions.
Taken together, these results suggest that while nonprofit compensation is broadly improving, the sector continues to grapple with internal pay equity, particularly ensuring that long-tenured staff in certain roles are not significantly out of step with current market rates, and that historically underpaid positions like administrative coordinators are adjusted upward to remain competitive.
Conclusions & Recommendations
Based on the quantitative and qualitative findings of the 2026 survey, the following recommendations are offered to nonprofits, funders, and boards working to strengthen our regional nonprofit workforce.
For Nonprofit Organizations
• Conduct regular wage analysis using this survey data as a benchmarking baseline.
• Formalize parental leave policies to build on Colorado FAMLI (38% are currently "not sure" of their offerings).
• Explore cooperative benefit models for pooled insurance purchasing.
• Invest in flexibility as a benefit: Flexible scheduling, compressed workweeks, and hybrid options are low-cost retention tools.
For Funders and Community Stakeholders
• Support operating costs and salaries: General operating support enables organizations to invest in their people.
• Facilitate shared-service models (finance, HR, IT) for small nonprofits.
• Address housing for nonprofit workers.
• Continue and expand this survey biennially with consistent methodology.
For Boards of Directors
• Use this data for compensation planning: Position-level benchmarks inform board-level decisions.
• Prioritize workforce investment: Organizations investing in compensation demonstrate measurably better retention.
“The survey gave our board confidence that our compensation package was competitive and aligned with local market conditions.”
— Summit County Nonprofit Leader